- Analytics
- Technical Analysis
EUR/USD Technical Analysis - EUR/USD Trading: 2015-04-20
Consolidation
Let us consider the EUR/USD currency pair on the H4 time frame. The price has made a bullish turn close to the triple bottom (1.05167) and is moving within an ascending corridor. To be noted, the triple bottom level was confirmed by RSI-Bars. The oscillator's side channel clearly indicates the consolidation. The price can gain a new momentum towards the green zone after having consolidated. Two resistance lines are located on the way: 1.08509 and 1.08934. They are both confirmed by the Donchian channel upper boundary, ParabolicSar historical values and Bill Williams fractals.
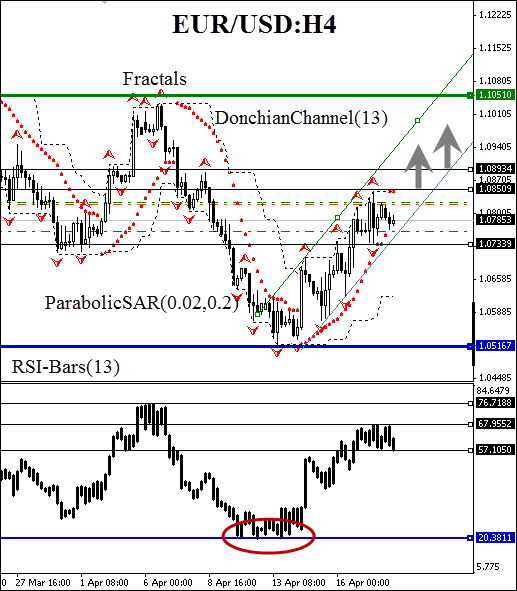
The daily resistance at 1.10510 is the closest mark to place a stop loss. Conservative traders are recommended to wait until the oscillator support is breached at 68% and open a partial volume position (50%), when the buy pending order (placed at 1.08509) is activated. The position may be built up as the next resistance line is breached at 1.08934. A stop loss may be placed at the closest support level at 1.07339. This mark is confirmed by Parabolic historical values and the H4 trend. After pending order activation the stop loss is to be moved every four hours near the next fractal low, following Parabolic signals. Thus we are changing the probable profit/loss ratio to the breakeven point.
| Position | Buy |
| Buy stop | above 1.08509 and 1.08934 |
| Stop loss | below 1.07339 |
- Get Certificate

Note:
This overview has an informative and tutorial character and is published for free. All the data, included in the overview, are received from public sources, recognized as more or less reliable. Moreover, there is no guarantee that the indicated information is full and precise. Overviews are not updated. The whole information in each overview, including opinion, indicators, charts and anything else, is provided only for familiarization purposes and is not financial advice or а recommendation. The whole text and its any part, as well as the charts cannot be considered as an offer to make a deal with any asset. IFC Markets and its employees under any circumstances are not liable for any action taken by someone else during or after reading the overview.
