- Analytics
- Technical Analysis
USD/CAD Technical Analysis - USD/CAD Trading: 2015-03-06
Nonfarm - Trader's day
Today at 14:30 CET we expect publication of macroeconomic indicators in US and Canada: Nonfarm and Building Permits correspondingly. The first one is released by Labor Department and shows an investment potential of US economy. Change of the indicator has a significant impact on consumer spending. It is worth to note that the indicator has a long term effect on the market (about one week). At the same time, Building Permits in Canada are to be released. The indicator is formed on a monthly basis, and shows the number of permits for new construction projects, issued by the government. The indicator provides an assessment of the growth potential of the real estate sector and the secondary demand of goods. We believe that release of this newsgroup can cause volatility of the USD/CAD currency pair.
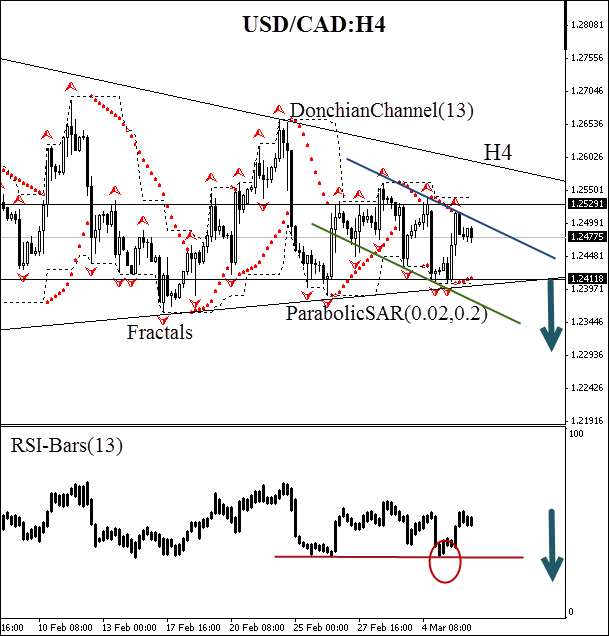
Let’s consider the H4 chart. A price is consolidated in triangle, but approaches a fractal support of 1.24118. A local trend, confirmed by Donchian Channel, has a bearish direction. That’s why a breakdown of this level is highly probable and certainly will lead to a reverse of Parabolic. However we should look for the RSI-Bars(13) confirmation. This indicator has formed a support of 32% and touched it three times. We suppose that a price breakdown should cause a crossing of the oscillator support. In this case we may rely on a new trend formation. The mark of 1.24118 may be used for the pending sell order placement. Risks may be limited by resistance 1.25291, which is verified by historical values of Parabolic, fractal and Donchian Channel boundary. After the pending order activation stop should be shifted each 4 hours according to the new fractal maximum. In such a way we optimize a potential profit/loss relation.
| Direction | Down |
| Sell stop | below 1.24118 |
| Stop loss | above 1.25291 |
- Get Certificate

Note:
This overview has an informative and tutorial character and is published for free. All the data, included in the overview, are received from public sources, recognized as more or less reliable. Moreover, there is no guarantee that the indicated information is full and precise. Overviews are not updated. The whole information in each overview, including opinion, indicators, charts and anything else, is provided only for familiarization purposes and is not financial advice or а recommendation. The whole text and its any part, as well as the charts cannot be considered as an offer to make a deal with any asset. IFC Markets and its employees under any circumstances are not liable for any action taken by someone else during or after reading the overview.
