- Analytics
- Technical Analysis
XAU/USD Technical Analysis - XAU/USD Trading: 2014-10-15
Standard making adjustments
Good afternoon, dear traders. Today Gold Standard Ventures, Nevada gold mining corporation, has released the data on the company’s core project, Railroad-Pinion Gold Project. All the works are done in the area of gold deposits named Carlin, not far from the Emigrant mine. The program of the sample analysis was launched in August 2014, in order to assess the project prospects. Today it has become aware that samples contained high gold content: 0.18 - 2.93 grams per ton of ore. According to the official data released, it would allow the company to increase the production volume and attract new funds to the Pinion project. The outlook for the supply growth in the gold market affected the trading results, which are influenced today by the bearish sentiment.
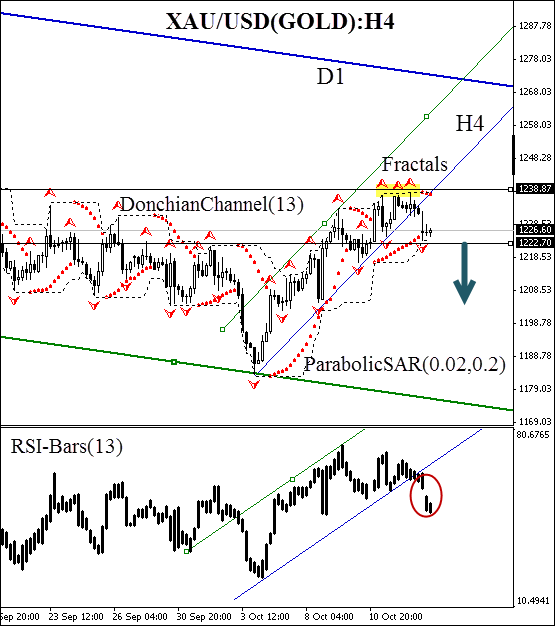
After position opening, Trailing Stop is to be moved after the Parabolic values, near the next fractal peak. Updating is enough to be done every day after the formation of 5 new H4 candlesticks, needed for the Bill Williams fractal formation. Thus, we are changing the probable profit/loss ratio to the breakeven point.
| Position | Sell |
| Sell stop | below 1222.70 |
| Stop loss | above 1238.87 |
Dear traders. You can see the detailed report of the author’s account by clicking here.
- Get Certificate

Note:
This overview has an informative and tutorial character and is published for free. All the data, included in the overview, are received from public sources, recognized as more or less reliable. Moreover, there is no guarantee that the indicated information is full and precise. Overviews are not updated. The whole information in each overview, including opinion, indicators, charts and anything else, is provided only for familiarization purposes and is not financial advice or а recommendation. The whole text and its any part, as well as the charts cannot be considered as an offer to make a deal with any asset. IFC Markets and its employees under any circumstances are not liable for any action taken by someone else during or after reading the overview.
