- Analytics
- Fundamental Analysis
- New Waves, New Records, and Treasuries Rally!
What should you expect from the USD Index?
Looking at published data released this week, mainly at CPI, retail sales, and Jobless Claims (Retail sales surged 9.8% in March and climbed 8.4% excluding autos & Initial jobless claims tumbled -193k to 576k), in line with excellent earning results was making it a bit hard to believe that the US Treasuries auction can have substantial and shocking gains.
On the other hand, some haven demands, too amid virus and vaccine anxieties, and some geopolitical risks helped the great sales while Japanese investors also back to the market after starting the new Japanese physical year from April first. After such marvelous and unexpected sales, the 10-year yield decreased ten bps to 1.530%, the lowest in a month.
USD Index - H1
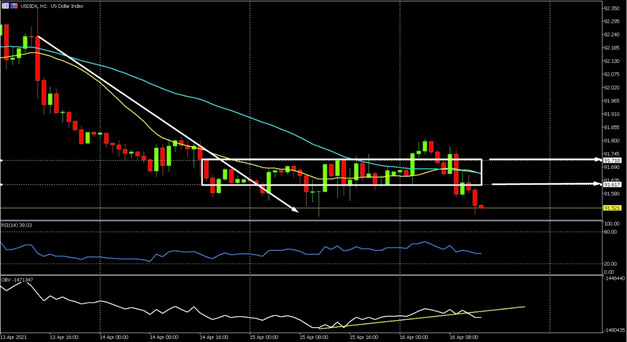
Since the dollar used to gain following higher Yields, fundamentally decreasing yields will push the USD to deeper levels. And technically, in the H1 chart, the USD index moves at a significant level. In the past days, DXY created a range between 91.61 and 91.71. OBV trend line also is broken to the downside. Price also moves under 20&50 HMA to prove technical downside signal. Under this level, 91.40 and 91.30 will be the following targets as S2 and S3. On the flip side, returning above 91.71 can open the doors for 91.90, 91.90 as R1, and R2.
Trade with a trusted and internationally recognized broker