- Analytics
- Technical Analysis
EUR/USD Technical Analysis - EUR/USD Trading: 2018-02-07
Euro is correcting down
On Tuesday, the rate of the single European currency has been weakening for the third day in a row. This is contributed by a number of factors. Will the euro continue to decline?
On Friday, the decline in EUR/USD began due to the positive labor market data for January. The number of Nonfarm payrolls exceeded forecasts. The average wage growth was the highest since 2009. On Monday, negative eurozone data were released on the slowdown in the retail sales growth in December. In addition, the ECB President Mario Draghi confirmed that the ECB will continue the monetary stimulus of the economy and the euro emission, till the eurozone inflation reaches 2%. Currently, it is 1.3%. This markedly reduces the likelihood of an early ECB rate hike. In turn, investors are confident that the Fed will raise the rate at its next meeting on March 21, 2018. The difference in the rate policy may support the dollar against the euro. On Tuesday, the eurozone Retail PMI by Markit decreased.
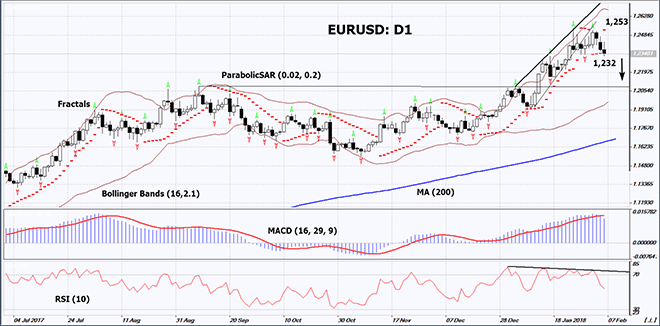
On the daily timeframe, EURUSD: D1 is trying to correct down in the frame of the long-term rising trend. The further price decrease is possible in case of the publication of positive economic news in the US and negative news in the EU.
- The Parabolic indicator gives a bearish signal.
- The Bollinger bands have widened, which means higher volatility.
- The RSI indicator is above 50. It has formed a negative divergence.
- The MACD indicator gives a bearish signal.
The bearish momentum may develop in case EURUSD drops below its last low at 1.232. This level may serve as an entry point. The initial stop loss may be placed below the two last fractal highs, the 3-year high and the Parabolic signal at 1.253. After opening the pending order, we shall move the stop to the next fractal high following the Bollinger and Parabolic signals. Thus, we are changing the potential profit/loss to the breakeven point. More risk-averse traders may switch to the 4-hour chart after the trade and place there a stop loss moving it in the direction of the trade. If the price meets the stop level at 1.253 without reaching the order at 1.232, we recommend cancelling the position: the market sustains internal changes that were not taken into account.
Summary of technical analysis
| Position | Sell |
| Sell stop | below 1,232 |
| Stop loss | above 1,253 |
- Get Certificate

Note:
This overview has an informative and tutorial character and is published for free. All the data, included in the overview, are received from public sources, recognized as more or less reliable. Moreover, there is no guarantee that the indicated information is full and precise. Overviews are not updated. The whole information in each overview, including opinion, indicators, charts and anything else, is provided only for familiarization purposes and is not financial advice or а recommendation. The whole text and its any part, as well as the charts cannot be considered as an offer to make a deal with any asset. IFC Markets and its employees under any circumstances are not liable for any action taken by someone else during or after reading the overview.
