- Analytics
- Technical Analysis
European Index Technical Analysis - European Index Trading: 2017-03-23
European indices may follow the US ones
In this report we consider studying the personal composite instrument (PCI) European stock indices. It reflects the dynamics of the European stock indices towards the euro. PCI may fall in case of correction in the European stock markets.
The main reason for the downtrend correction in Eurozone is the global negative trend. It may show itself at the US stock exchanges if investors decide that the implementation of the economic reforms by the newly elected US president Donald Trump may be hindered. The reforms are aimed at supporting the manufacturing companies. The US stocks were advancing ahead of the reforms. The first step shall be the revocation of Obamacare medical program after the voting in US Congress this Thursday. If Congressmen support the Trump’s initiative, the stock market may start correcting. Worsened economic indicators may be additional negative for Eurozone. The trade balance in eurozone in January 2017 was negative for the first time in recent 3 years. This made the positive current account balance (NSA) in Eurozone also to fall in January to 3-year low. The investigation into the actions of the Dutch bank ING may lead to the same substantial fines as which received Deutsche Bank and Volkswagen.
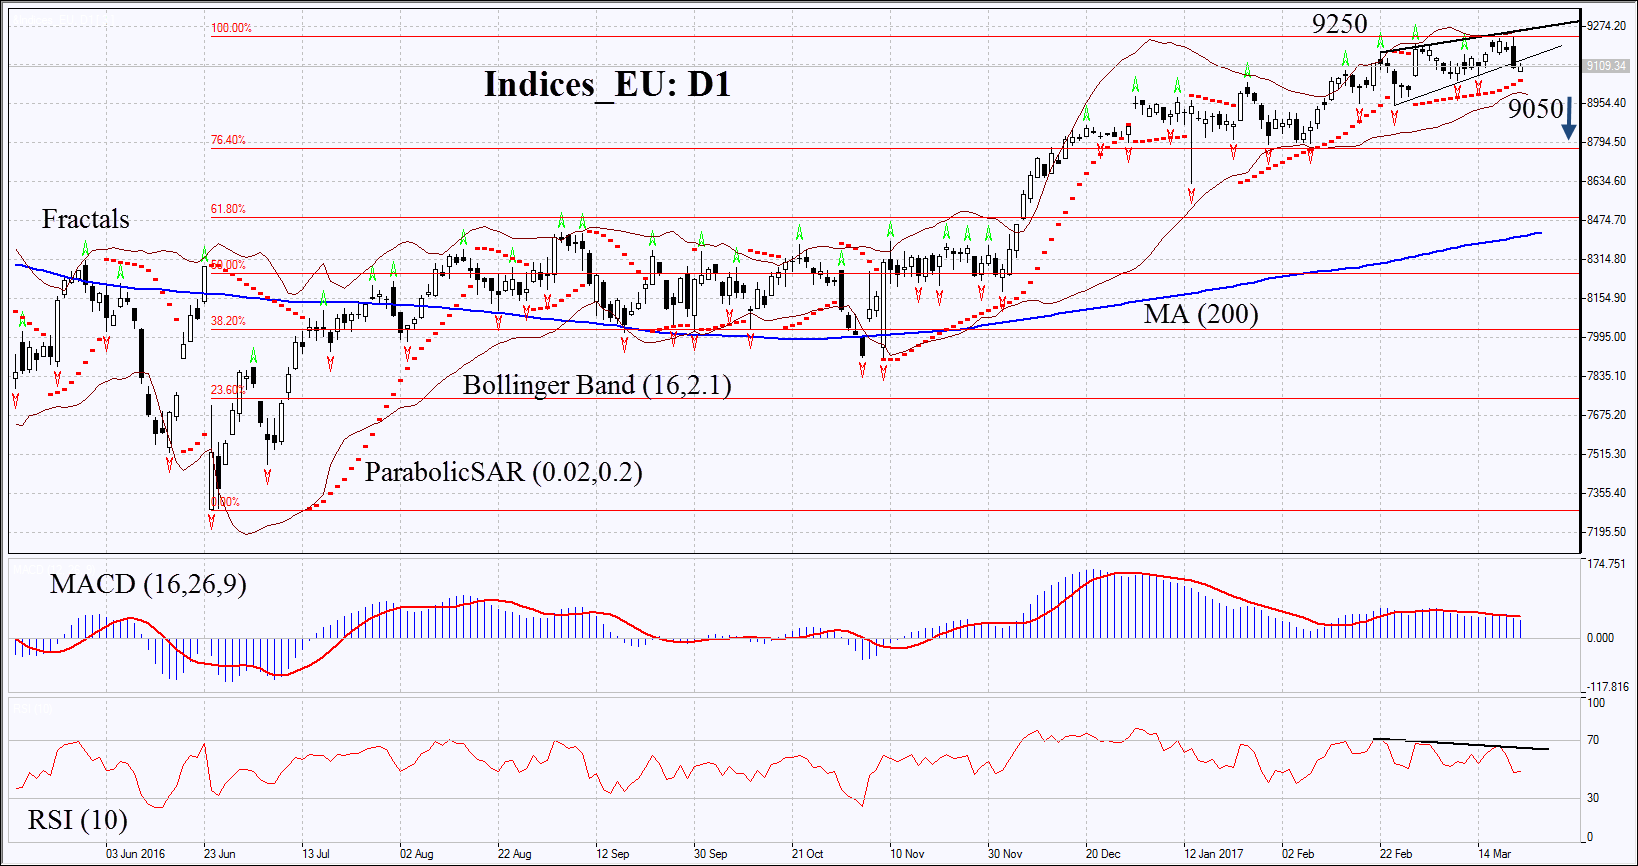
On the daily chart Indices-EU: D1 has previously hit a 18-month low. Now it is struggling to correct down. Its further decline is possible in case of negative news from Europe and lower global indices.
- The Parabolic gives bullish signals which may also serve the additional level of support. To open short position it shall be broken down through.
- The Bollinger bands have narrowed which means lower volatility.
- The RSI is below 50. It has formed positive divergence.
- The MACD is giving bearish signals.
The bearish momentum may develop in case Indices-EU falls below the two last fractal lows and the Parabolic signal at 9050. This level may serve the point of entry. The initial stop-loss may be placed above the last fractal high and the 18-month high at 9250. Having opened the pending order we shall move the stop to the next fractal high following the Parabolic and Bollinger signals. Thus, we are changing the probable profit/loss ratio to the breakeven point. The most risk-averse traders may switch to the 4-hour chart after the trade and place there a stop-loss moving it in the direction of the trade. If the price meets the stop-loss level at 9250 without reaching the order at 9050, we recommend cancelling the position: the market sustains internal changes which were not taken into account.
Summary of technical analysis
| Position | Sell |
| Sell stop | below 9050 |
| Stop loss | above 9250 |
- Get Certificate

Note:
This overview has an informative and tutorial character and is published for free. All the data, included in the overview, are received from public sources, recognized as more or less reliable. Moreover, there is no guarantee that the indicated information is full and precise. Overviews are not updated. The whole information in each overview, including opinion, indicators, charts and anything else, is provided only for familiarization purposes and is not financial advice or а recommendation. The whole text and its any part, as well as the charts cannot be considered as an offer to make a deal with any asset. IFC Markets and its employees under any circumstances are not liable for any action taken by someone else during or after reading the overview.
