- Analytics
- Technical Analysis
USD/JPY Technical Analysis - USD/JPY Trading: 2017-11-13
Preparing for the publication of the Japan GDP
The possible delay in Trump’s tax reform weakened the US dollar. Is there a possibility for the Japanese yen to strengthen? On the USDJPY chart, it looks like a decline.
The Japanese economic data may become an additional positive factor for the yen. Industrial equipment orders rose to 49.9% in October 2017, from 45% in September. Wholesale prices rose by 3.4%. Theoretically, this may forecast the inflation growth. Recall that the Bank of Japan's target level for inflation is 2%, meanwhile actually it amounts to 0.7%. In case this indicator increases, the Bank of Japan may tighten its monetary policy. Currently, it is implementing money emission and maintains a negative rate of -0.1%. On Wednesday morning, the GDP data for Q3 will be published in Japan, which may affect the yen exchange rate.
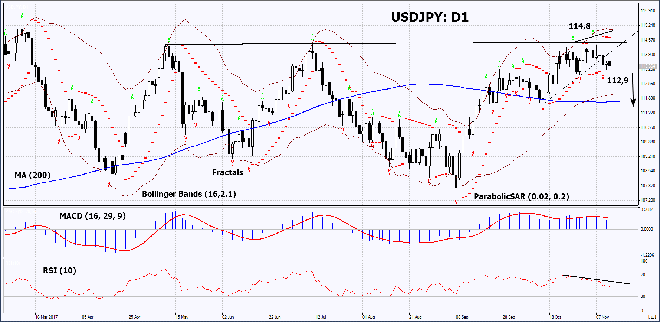
On the daily timeframe, USDJPY: D1 reached the resistance level of the neutral range the quotes could not exceed it and are moving in the direction of the lower boundary. A downward correction is possible in case of the publication of negative economic and corporate data in the US and positive data Japan.
- The Parabolic indicator gives a bearish signal.
- The Bollinger bands have narrowed, which means lower volatility.
- The RSI indicator is below 50. It has formed a negative divergence.
- The MACD indicator gives a bearish signal.
The bullish momentum may develop in case USDJPY drops below the two last fractal lows at 112.9. This level may serve as an entry point. The initial stop loss may be placed above the last fractal high and the Parabolic signal at 114.7. After opening the pending order, we shall move the stop to the next fractal high following the Bollinger and Parabolic signals. Thus, we are changing the potential profit/loss to the breakeven point. More risk-averse traders may switch to the 4-hour chart after the trade and place there a stop loss moving it in the direction of the trade. If the price meets the stop level at 112.9 without reaching the order at 114.7, we recommend cancelling the position: the market sustains internal changes that were not taken into account.
Summary of technical analysis
| Position | Sell |
| Sell stop | below 112,9 |
| Stop loss | above 114,7 |
- Get Certificate

Note:
This overview has an informative and tutorial character and is published for free. All the data, included in the overview, are received from public sources, recognized as more or less reliable. Moreover, there is no guarantee that the indicated information is full and precise. Overviews are not updated. The whole information in each overview, including opinion, indicators, charts and anything else, is provided only for familiarization purposes and is not financial advice or а recommendation. The whole text and its any part, as well as the charts cannot be considered as an offer to make a deal with any asset. IFC Markets and its employees under any circumstances are not liable for any action taken by someone else during or after reading the overview.
