- Analytics
- Technical Analysis
US Dollar Index Technical Analysis - US Dollar Index Trading: 2018-02-06
US dollar index is trying to advance
Investors are confident in a Fed rate hike at its next meeting, which will take place on March 21, 2018. Will the US dollar index quotes rise?
Since the beginning of 2017, it slumped by 13.5% and at the end of January 2018 updated its 3-year low. The beginning of a possible upward correction of the USDX was contributed by the economic data on the US labor market for January, published at the end of the last week - on Friday. It appeared that the average wage has been growing at the highest rate for the last 8 years. The expectations of a Fed rate hike contributed to an increase in the 10-year Treasury yields to the 4-year high. They approached 2.9% in annual terms. This week no particularly important US economic indicators are expected to be released, but several Fed representatives will speak. Their speeches may affect the foreign exchange market dynamics.
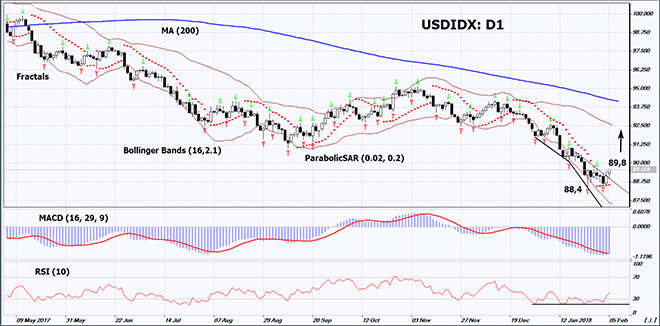
On the daily timeframe, USDIDX: D1 is correcting upwards after updating the 3-year low. The further price increase is possible in case of the publication of positive economic data in the US and a Fed rate hike.
- The Parabolic indicator gives a bullish signal.
- The Bollinger bands have widened, which means higher volatility.
- The RSI indicator is below 50. It has formed a positive divergence.
- The MACD indicator gives a bullish signal.
The bearish momentum may develop in case USDIDX exceeds the last fractal high at 89.8. This level may serve as an entry point. The initial stop loss may be placed below the two last fractal lows, the 3-year low and the Parabolic signal at 88.4. After opening the pending order, we shall move the stop to the next fractal low following the Bollinger and Parabolic signals. Thus, we are changing the potential profit/loss to the breakeven point. More risk-averse traders may switch to the 4-hour chart after the trade and place there a stop loss moving it in the direction of the trade. If the price meets the stop level at 88.4 without reaching the order at 89.8, we recommend cancelling the position: the market sustains internal changes that were not taken into account.
Summary of technical analysis
| Position | Buy |
| Buy stop | above 89,8 |
| Stop loss | below 88,4 |
- Get Certificate

Note:
This overview has an informative and tutorial character and is published for free. All the data, included in the overview, are received from public sources, recognized as more or less reliable. Moreover, there is no guarantee that the indicated information is full and precise. Overviews are not updated. The whole information in each overview, including opinion, indicators, charts and anything else, is provided only for familiarization purposes and is not financial advice or а recommendation. The whole text and its any part, as well as the charts cannot be considered as an offer to make a deal with any asset. IFC Markets and its employees under any circumstances are not liable for any action taken by someone else during or after reading the overview.
