- Analytics
- Technical Analysis
AUD/USD Technical Analysis - AUD/USD Trading: 2014-10-03
Australian dollar versus the Greenback
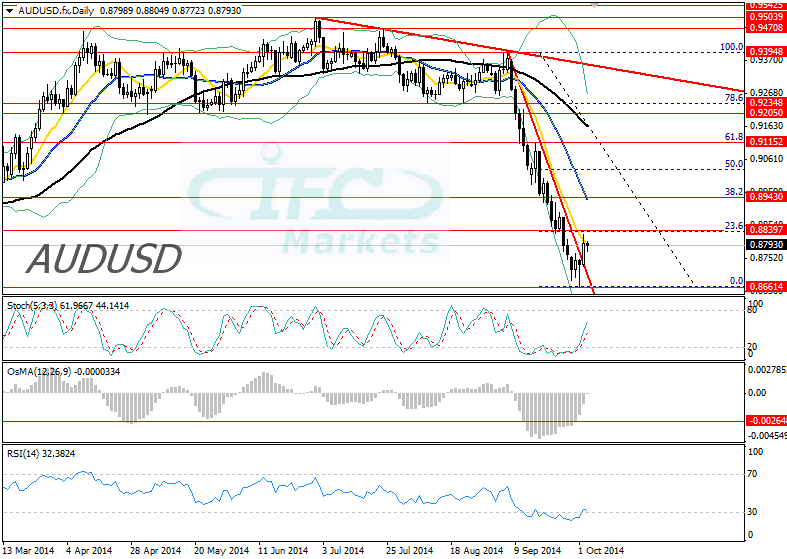
Hello, dear traders. Today we are going to analyze the Aussie against the US dollar chart. The currency pair bearish bias drove prices to a more than an 8-month low at 0.8661. Downside structure has been strong as indicated by the steep falling trend line. The steep falling trend line though was breached yesterday after the formation of a “Hammer with bullish Engulfing candlesticks”. That also shows the AUDUSD is making its larger correction since the 5th of September. The 10 day moving average is now limiting the pull back slightly below the resistance at 0.8839, however prices could continue to 38.2% Fibonacci retracement at 0.8934. Lastly, the support at 0.8661 appears to be a strong one because is the second time that maintains a strong bearish wave.
- Get Certificate

Note:
This overview has an informative and tutorial character and is published for free. All the data, included in the overview, are received from public sources, recognized as more or less reliable. Moreover, there is no guarantee that the indicated information is full and precise. Overviews are not updated. The whole information in each overview, including opinion, indicators, charts and anything else, is provided only for familiarization purposes and is not financial advice or а recommendation. The whole text and its any part, as well as the charts cannot be considered as an offer to make a deal with any asset. IFC Markets and its employees under any circumstances are not liable for any action taken by someone else during or after reading the overview.
