- Analytics
- Technical Analysis
Cotton Technical Analysis - Cotton Trading: 2018-08-30
Estimates of higher consumption bullish for cotton prices
USDA estimated higher world cotton consumption and lower beginning stocks in 2018/19. Will the cotton price continue rising?
The US Department of Agriculture WASDE August report estimated world 2018/19 ending stocks 1% lower this month, due to a combination of lower beginning stocks and higher consumption offsetting higher production. Beginning stocks were also reduced 450,000 bales, reflecting both lower production and higher consumption estimates. Forecasts of higher cotton consumption and lower production are bullish for cotton prices. And weather agencies reports that India’s monsoons are coming irregularly for the major cotton province of Gujarat may are also bullish for cotton prices.
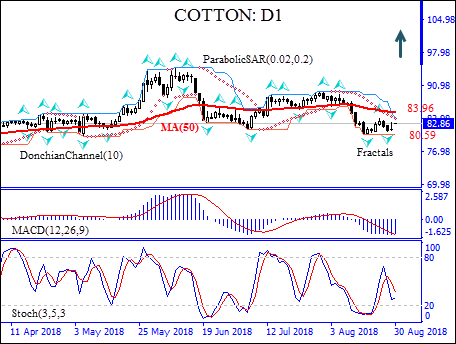
On the daily timeframe the COTTON: D1 is below the 50-day moving average MA(50) which is leveling off.
- The Parabolic indicator gives a sell signal.
- The Donchian channel indicates downtrend: it is tilted lower.
- The MACD indicator gives a bullish signal: it is below the signal line and the gap is widening.
- The Stochastic oscillator is rising but has not reached the overbought zone.
We believe the bullish momentum will continue after the price breaches above the upper boundary of Donchian channel at 83.96. This level can be used as an entry point for placing a pending order to Buy. The stop loss can be placed below the upper Donchian boundary at 80.59. After placing the order, the stop loss is to be moved every day to the next fractal low, following Parabolic signals. Thus, we are changing the probable profit/loss ratio to the breakeven point. If the price meets the stop loss level (80.59) without reaching the order (83.96), we recommend cancelling the order: the market has undergone internal changes which were not taken into account.
Technical Analysis Summary
| Position | Buy |
| Buy stop | Above 83.96 |
| Stop loss | Below 80.59 |
- Get Certificate

Note:
This overview has an informative and tutorial character and is published for free. All the data, included in the overview, are received from public sources, recognized as more or less reliable. Moreover, there is no guarantee that the indicated information is full and precise. Overviews are not updated. The whole information in each overview, including opinion, indicators, charts and anything else, is provided only for familiarization purposes and is not financial advice or а recommendation. The whole text and its any part, as well as the charts cannot be considered as an offer to make a deal with any asset. IFC Markets and its employees under any circumstances are not liable for any action taken by someone else during or after reading the overview.
