- Analytics
- Technical Analysis
EUR/USD Technical Analysis - EUR/USD Trading: 2015-04-03
Non-Farm – trader's day
Today at 14:30 CET labor market official statistics will be released in the USA. Last week Initial Jobless Claims are the first to pay attention to. The data are compiled by Department of Labor and reflect internal demand dynamics and consumer loan potential. Non-Farm Employment change, announced by Department of Labor at the same time, register new jobs excluding farming sector. The indicator has a significant impact on consumer spending and investment appeal. To be noted, it is published among the first and has a long-term effect on the market (up to one week). These fundamentals may boost currencies, related to dollar.
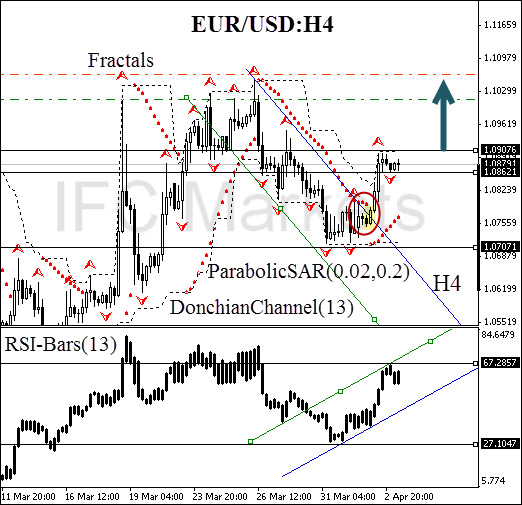
Let us consider the EUR/USD currency pair on the H4 chart. The price crossed the H4 resistance line upwards, simultaneously forming the "absorption" candlestick pattern (marked with a yellow rectangle on the chart) and the “double bottom” pattern. Both signals indicate a shift in market sentiment. After the resistance was breached, ParabolicSAR turned towards the green zone as Donchian Channel shaped a positive incline. All the signals look to further bullish trend. RSI-Bars is going to cross the resistance at 67%, confirming our assumptions. In our opinion, it may happen as soon as the price passes 1.09076 mark, which can be used for placing a buy pending order. Stop loss is supposed to be located at the fractal support line, confirmed by the “double bottom”.
After pending order activation stop loss should be moved every four hours, following Parabolic signals. Thus we change the probable profit/loss ratio to the breakeven point.
| Position | Buy |
| Buy stop | above 1.09076 |
| Stop loss | below 1.07071 |
- Get Certificate

Note:
This overview has an informative and tutorial character and is published for free. All the data, included in the overview, are received from public sources, recognized as more or less reliable. Moreover, there is no guarantee that the indicated information is full and precise. Overviews are not updated. The whole information in each overview, including opinion, indicators, charts and anything else, is provided only for familiarization purposes and is not financial advice or а recommendation. The whole text and its any part, as well as the charts cannot be considered as an offer to make a deal with any asset. IFC Markets and its employees under any circumstances are not liable for any action taken by someone else during or after reading the overview.
