- Analytics
- Technical Analysis
GBP/USD Technical Analysis - GBP/USD Trading: 2019-12-10
UK GDP miss bearish for GBPUSD
UK GDP was steady over month in October after 0.1% decline in previous month, while 0.1% growth was forecast. Will the GBPUSD decline?
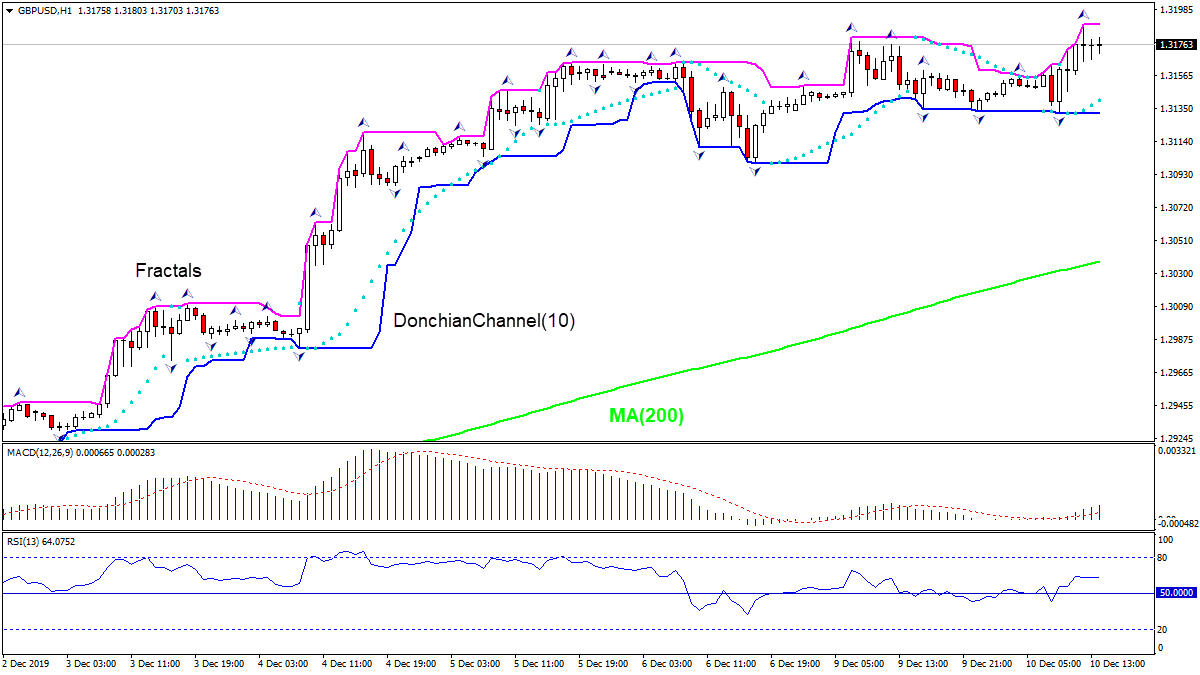
The price chart on 1-hour timeframe shows GBPUSD: H1 is trading sideways. The price is rising above the 200-period moving average MA(200) which is rising. And the RSI oscillator is falling toward 50 level. There is no trend yet formed, traders have to decide when it would be a best time to enter the market.
- Get Certificate

Note:
This overview has an informative and tutorial character and is published for free. All the data, included in the overview, are received from public sources, recognized as more or less reliable. Moreover, there is no guarantee that the indicated information is full and precise. Overviews are not updated. The whole information in each overview, including opinion, indicators, charts and anything else, is provided only for familiarization purposes and is not financial advice or а recommendation. The whole text and its any part, as well as the charts cannot be considered as an offer to make a deal with any asset. IFC Markets and its employees under any circumstances are not liable for any action taken by someone else during or after reading the overview.
