- Analytics
- Technical Analysis
Nikkei 225 Technical Analysis - Nikkei 225 Trading: 2018-04-11
Japanese companies can benefit from the US-China trade war
There is a trade war between China and the US, which is expressed in the mutual increase in import duties. Can the Japanese economy benefit from this? Will Nikkei prices rise?
It should be noted that China is already ready to make concessions to the US and reduce duties on car imports and improve the protection of intellectual property. On the one hand, this reduces the reciprocal pressure on Chinese imports to the US, but on the other hand, such a statement weakened the Japanese yen previously considered by investors as a safe haven currency amid risks in the region. The emerging weakening of the yen makes the products of Japanese exporting companies more competitive. The possible reduction in import duties on foreign cars to China, on Tuesday, contributed to the growth of stocks of Japanese companies such as Toyota Motor, Honda Motor, Mazda Motor and Komatsu, as well as manufacturers of industrial equipment Fanuc and Okuma. This week, no significant economic statistics are expected to be published in Japan.
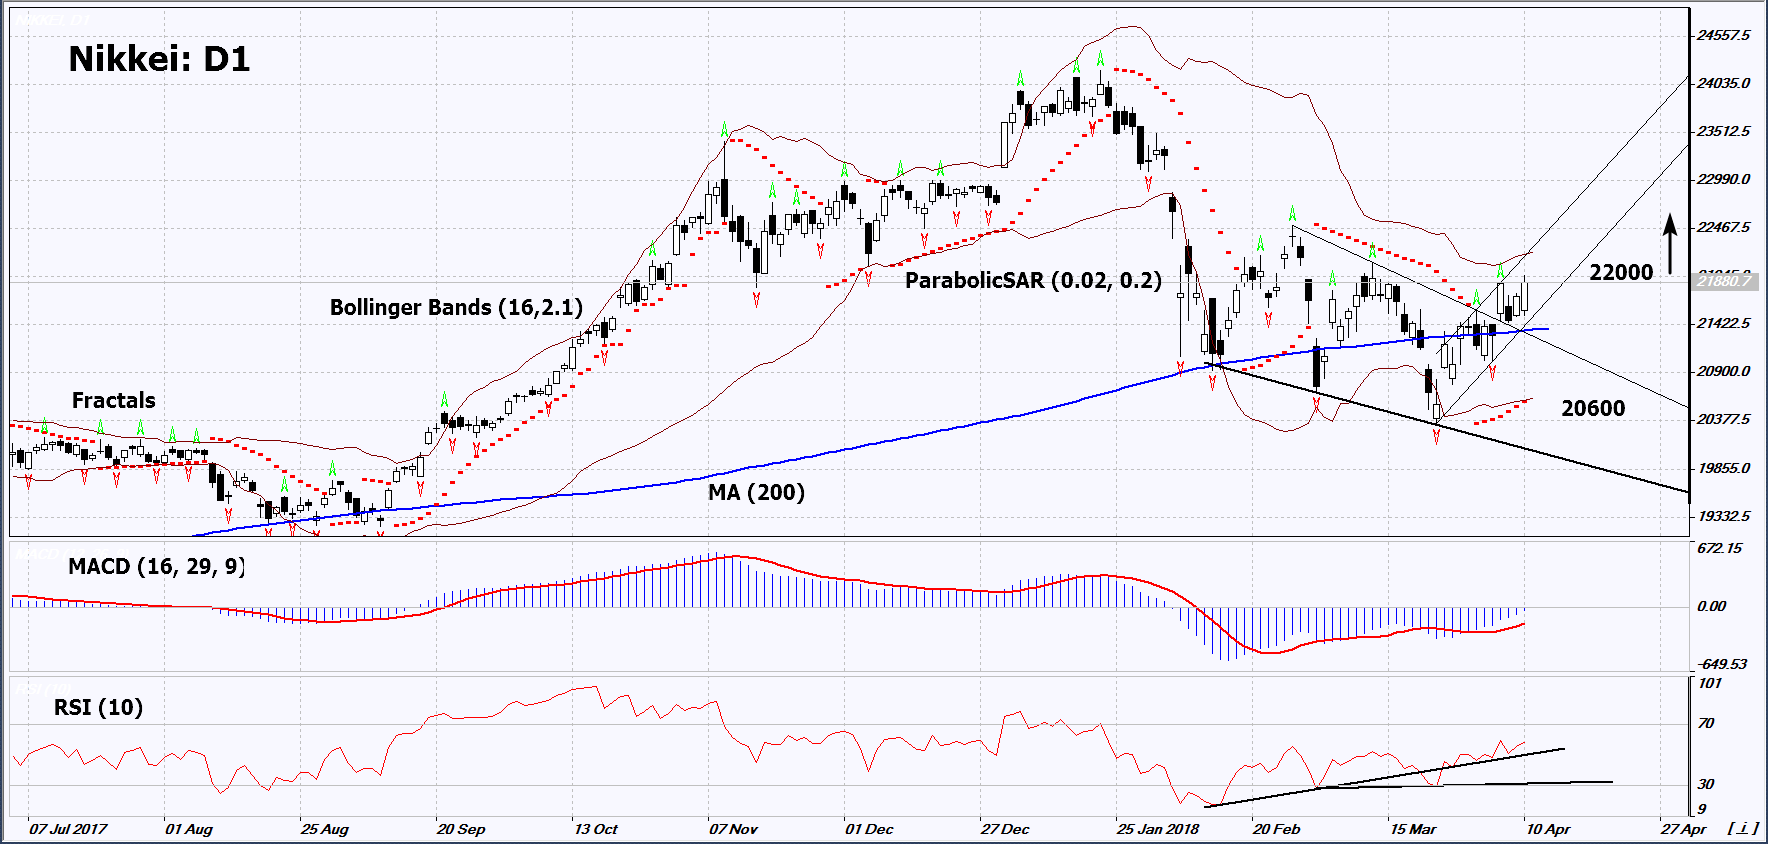
On the daily timeframe, Nikkei: D1 breached above the resistance line of the downtrend. The further price increase is possible in case of the publication of positive data on the economy of Japan and earnings reports.
- The Parabolic indicator gives a bullish signal.
- The Bollinger bands have widened, which indicates high volatility. They are titled upward.
- The RSI indicator is above 50. It has formed a positive divergence.
- The MACD indicator gives a bullish signal.
The bullish momentum may develop in case Nikkei exceeds the last fractal high and the psychological level at 22000. This level may serve as an entry point. The initial stop loss may be placed below the last fractal low, the lower Bollinger band and the Parabolic signal at 20600. After opening the pending order, we shall move the stop to the next fractal low following the Bollinger and Parabolic signals. Thus, we are changing the potential profit/loss to the breakeven point. More risk-averse traders may switch to the 4-hour chart after the trade and place there a stop loss moving it in the direction of the trade. If the price meets the stop level at 20600 without reaching the order at 22000 we recommend to close the position: the market sustains internal changes that were not taken into account
Summary of technical analysis
| Position | Buy |
| Buy stop | Above 22000 |
| Stop loss | Below 20600 |
- Get Certificate

Note:
This overview has an informative and tutorial character and is published for free. All the data, included in the overview, are received from public sources, recognized as more or less reliable. Moreover, there is no guarantee that the indicated information is full and precise. Overviews are not updated. The whole information in each overview, including opinion, indicators, charts and anything else, is provided only for familiarization purposes and is not financial advice or а recommendation. The whole text and its any part, as well as the charts cannot be considered as an offer to make a deal with any asset. IFC Markets and its employees under any circumstances are not liable for any action taken by someone else during or after reading the overview.
