- Analytics
- Technical Analysis
SUGAR Technical Analysis - SUGAR Trading: 2015-06-30
Probable upturn after longstanding low
Today we present you the continuous SUGAR CFD. After rebounding from the recent 6.5-year low it has been demonstrating sustainable growth. The reason is the lowered forecast for sugar crops in Brazil and Central America. Apart from it China reported the 20% decrease in sugar-cane acreage in Guangxi region and the 37% contraction in Hainan region (the season 2015/2016). Vietnam expects the 10.2% drop in sugar production as compared to the previous year. This news came along with the July futures expiration at Intercontinental Exchange, accompanied with a wide-scale position coverage. Thus, the sugar quotes may have advanced partly due to technical factors, which increases risks. Growth in prices should come amid negative crops forecasts.
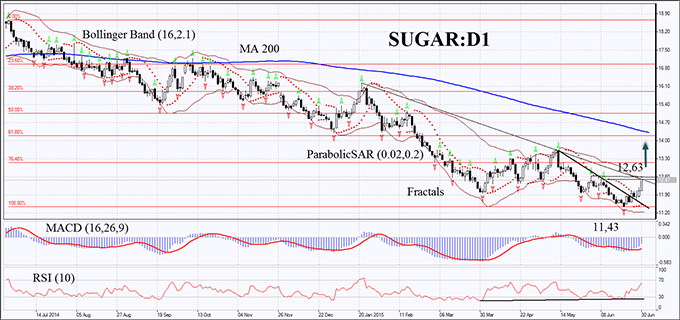
The SUGAR CFD tends to go up on the daily time frame. After escaping the bearish trend it has been trying to shape the double bottom analysis pattern. Bollinger Bands have expanded, indicating growing volatility. The latest MACD bars are located below the zero and the signal levels, which appears to be a bullish signal. Parabolic does not contradict the MACD indicator. RSI-Bars have been moving up but has not yet reached the overbought zone. The sugar CFD chart is far from Fibonacci levels. The bullish momentum may continue, if the next bar closes above the Bollinger upper boundary and two fractal highs that are now located at 12.63. A stop loss may be placed at the latest Parabolic lower mark at 11.5 or below the 6.5-year price minimum at 11.43. After pending order placing, the stop loss is supposed to be moved every four hours near the next fractal low, following Parabolic and Bollinger signals. Thus, we are changing the probable profit/loss ratio to the breakeven point. The most cautious traders are recommended to switch to the H4 time frame and place a stop loss, moving it after the trend. If the price reaches the stop level without triggering the order we recommend to cancel the position: the market sustains internal changes that were not considered.
| Position | Buy |
| Buy stop | above 12.63 |
| Stop loss | below 11.5 or 11.43 |
- Get Certificate

Note:
This overview has an informative and tutorial character and is published for free. All the data, included in the overview, are received from public sources, recognized as more or less reliable. Moreover, there is no guarantee that the indicated information is full and precise. Overviews are not updated. The whole information in each overview, including opinion, indicators, charts and anything else, is provided only for familiarization purposes and is not financial advice or а recommendation. The whole text and its any part, as well as the charts cannot be considered as an offer to make a deal with any asset. IFC Markets and its employees under any circumstances are not liable for any action taken by someone else during or after reading the overview.
