- Analytics
- Technical Analysis
Stock portfolio in High-Tech industry Technical Analysis - Stock portfolio in High-Tech industry Trading: 2017-06-27
Technology stocks lead in bull market
Technology stocks are leading the market. Let’s study the performance of a PCI – Technology stocks index , composed of stocks of world’s biggest technology companies. Will the index rise?
After a selloff last couple weeks on higher valuation concerns technology stocks keep rebounding. While the recent rally stretched the valuation of growth stocks including tech stocks, the valuations are still low compared with the highs reached during the tech boom of the late 1990s, according to Citigroup’s analysts. The largest technology stocks have returned about triple the S&P 500 Index in 2017 year-to-date. Concerns that prices have risen to unsustainable levels caused the last week’s selloff, as some investors considered rotating into value stocks. Citigroup analysts note that such a shift in the past 20 years has occurred only after a bull market has ended. Current price-to-book ratio for US growth stocks is five times, compared with a multiple of 17 during the late 1990s.
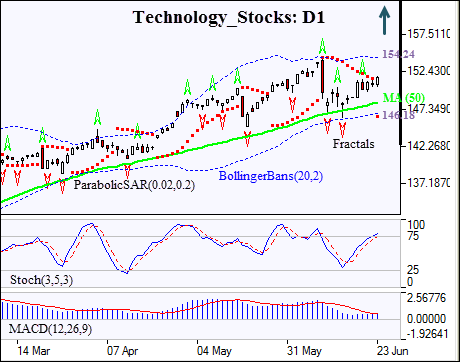
On the daily chart the Technology_Stocks: D1 has been rebounding after a plunge in early June. The price has remained above the 50-day moving average MA(50).
- The Bollinger bands are narrowing, indicating declining volatility.
- The Parabolic indicator has formed a buy signal.
- The MACD indicator is above the signal line and the gap is rising which is a bullish signal.
- The Stochastic oscillator has breached into the overbought zone which is a bearish signal.
We believe the bullish momentum will continue after the price closes above the upper Bollinger band at 154.24. It can be used as an entry point for a pending order to buy. The stop loss can be placed below the last fractal low at 146.18. After placing the pending order, the stop loss is to be moved to the next fractal low, following Parabolic signals. By doing so, we are changing the probable profit/loss ratio to the breakeven point. The most risk-averse traders may switch to the 4-hour chart after the trade and place there a stop-loss moving it in the direction of the trade. If the price meets the stop loss level (146.18) without reaching the order (154.24), we recommend canceling the position: the market sustains internal changes which were not taken into account.
Technical Analysis Summary
| Position | Buy |
| Buy stop | Above 154.24 |
| Stop loss | Below 146.18 |
- Get Certificate

Note:
This overview has an informative and tutorial character and is published for free. All the data, included in the overview, are received from public sources, recognized as more or less reliable. Moreover, there is no guarantee that the indicated information is full and precise. Overviews are not updated. The whole information in each overview, including opinion, indicators, charts and anything else, is provided only for familiarization purposes and is not financial advice or а recommendation. The whole text and its any part, as well as the charts cannot be considered as an offer to make a deal with any asset. IFC Markets and its employees under any circumstances are not liable for any action taken by someone else during or after reading the overview.
