- Analytics
- Technical Analysis
Wheat Ruble Technical Analysis - Wheat Ruble Trading: 2017-10-30
World grain consumption is growing faster than its production
In this review, we suggest considering the personal composite instrument (PCI) "Wheat versus Russian ruble". It grows in case of the increasing wheat price in the global market and the weakening of the Russian ruble. Is there a possibility for the WHEAT/RUB prices to increase?
The Australian government revised down the grain crop forecast in the 2017/18 season from 21.64 mln tonnes to 20.15 mln tonnes, which is by 40% lower than the historically high crop of 35.56 mln tonnes in the previous season. Due to the drought, the wheat yield in Australia may fall to 1.72 tonnes per hectare in the 2017/18 season. This is the lowest for the last 8 seasons and by 36% less than the 2.7 tonnes per hectare in the 2016/17 season. International Grains Council (IGC) raised its forecast of the world grain production by 6 mln tonnes to 2,075 bln tonnes in the agricultural season of 2017/18. This is by 2.7% less than in the previous 2016/17 season. World grain consumption may increase by 8 mln tonnes and amount to 2.104 bln tonnes. This is more than the expected crop increase. The difference will be replenished at the expense of world reserves. IGC forecasts the growth of the world wheat crop by 1.2% in the 2017/18 season compared to the previous season - up to 748.5 mln tonnes. The Russian ruble is weakening against the US dollar after the Bank of Russia cut its key rate from 8.5% to 8.25% at its October 27 meeting. The rate still markedly exceeds the inflation of about 3.3%. This gives grounds to assume that the CB of the Russian Federation will continue the policy of rate reduction.
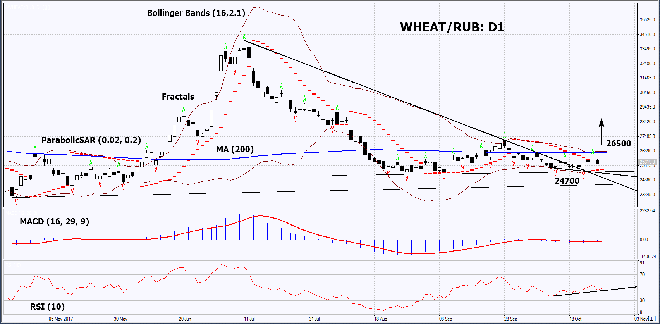
On the daily timeframe, WHEAT/RUB: D1 is in the neutral trend near the 200-day moving average line. Further price increase is possible in case of the further decrease of the Bank of Russia rate and the reduction in the world wheat crop.
- The Parabolic indicator gives a bullish signal.
- The Bollinger bands have narrowed, which means lower volatility.
- The RSI indicator is below 50. It has formed a positive divergence.
- The MACD indicator gives a bullish signal.
The bullish momentum may develop in case WHEAT/RUB exceeds the Upper Bollinger band, the three last fractal highs and the 200-day moving average line at 26500. This level may serve as an entry point. The initial stop loss may be placed below all the last fractal lows, the 5-month low, the lower Bollinger band and the Parabolic signal at 24700. After opening the pending order, we shall move the stop to the next fractal low following the Bollinger and Parabolic signals. Thus, we are changing the potential profit/loss to the breakeven point. More risk-averse traders may switch to the 4-hour chart after the trade and place there a stop loss moving it in the direction of the trade. If the price meets the stop level at 24700 without reaching the order at 26500, we recommend cancelling the position: the market sustains internal changes that were not taken into account.
Summary of technical analysis
| Position | Buy |
| Buy stop | above 26500 |
| Stop loss | below 24700 |
Explore our
Trading Conditions
- Spreads from 0.0 pip
- 30,000+ Trading Instruments
- Stop Out Level - Only 10%
Ready to Trade?
Open Account Note:
This overview has an informative and tutorial character and is published for free. All the data, included in the overview, are received from public sources, recognized as more or less reliable. Moreover, there is no guarantee that the indicated information is full and precise. Overviews are not updated. The whole information in each overview, including opinion, indicators, charts and anything else, is provided only for familiarization purposes and is not financial advice or а recommendation. The whole text and its any part, as well as the charts cannot be considered as an offer to make a deal with any asset. IFC Markets and its employees under any circumstances are not liable for any action taken by someone else during or after reading the overview.
