- Analytics
- Technical Analysis
Gold vs AUD Technical Analysis - Gold vs AUD Trading: 2017-07-25
Preparing for the release of important statistics
In this review, we suggest considering the personal composite instrument (PCI) "XAUAUD". It reflects the price dynamics of gold against the Australian dollar.Is there a possibility of XAUAUD prices growth?
The PCI rises in case of an increase in the world gold prices and the weakening of the Australian dollar. Since the beginning of May of this year, the Australian dollar has already strengthened against the US dollar by more than 8% reaching a 2-year high. A downward correction is quite possible if the Australian inflation data for Q2, 2017 turn out to be negative. They will be published on Wednesday, July 26. Gold reached the highest level in a month and may continue to advance in case of a negative assessment of the current state of the US economy according to the US Fed next meeting minutes. It will also be held on Wednesday, July 26.
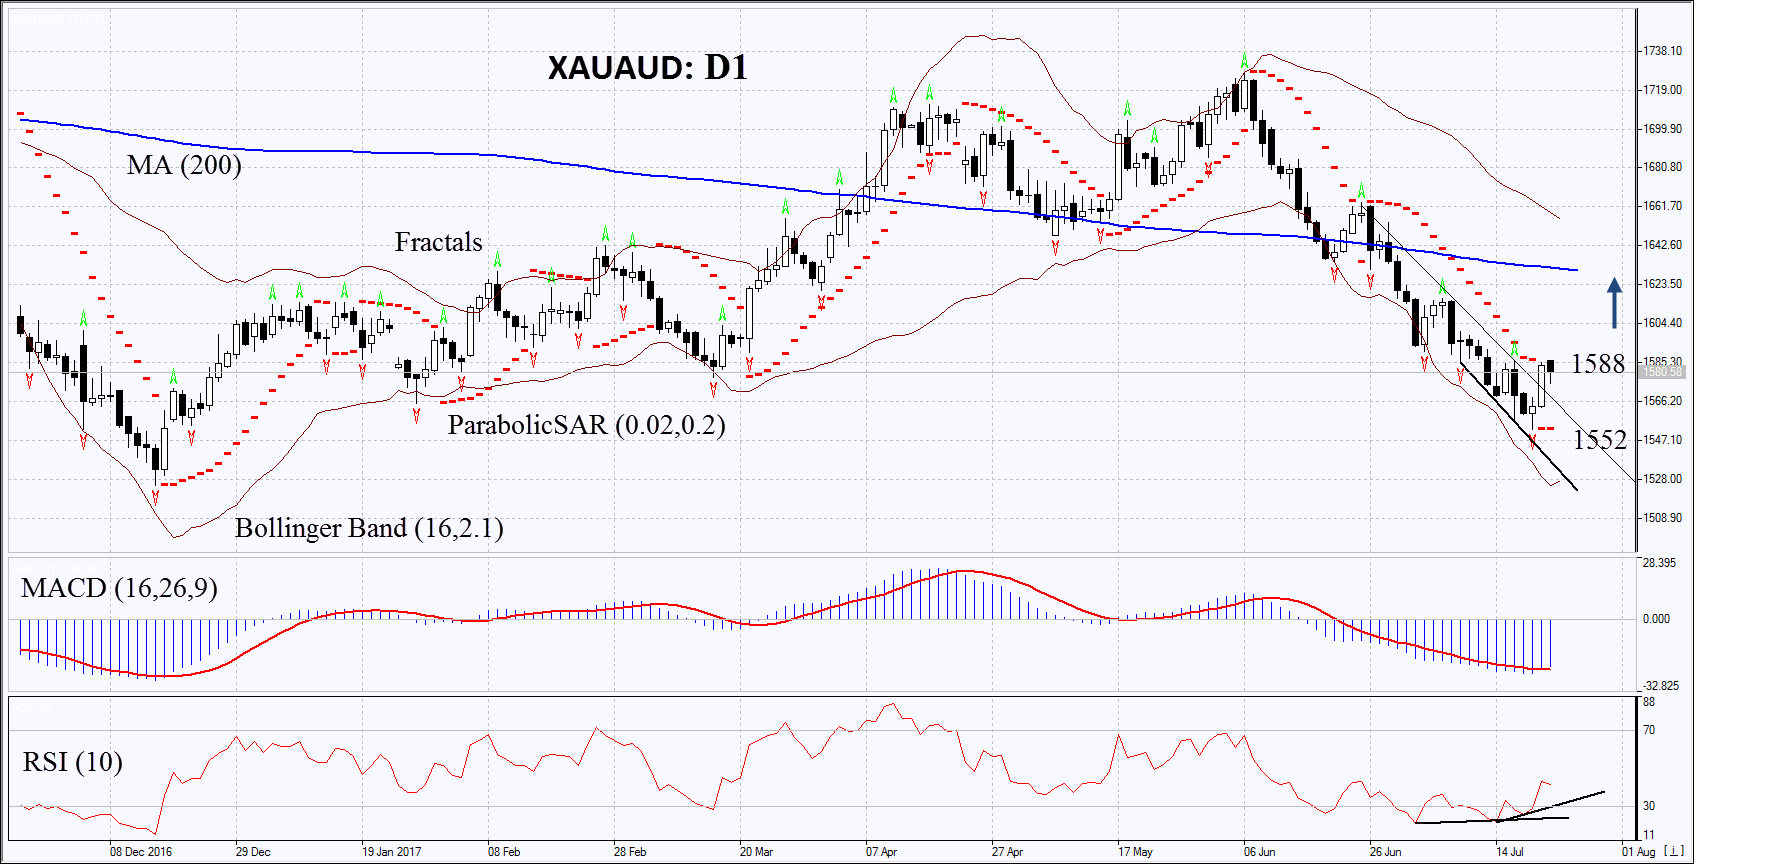
On the daily timeframe, XAUAUD: D1 has edged up from the downtrend. The further price growth is possible in case of an increase in the world gold prices, as well as in case of the worsening of the Australian economic indicators.
- The Parabolic indicator gives a bullish signal.
- The Bollinger bands have markedly widened, which means high volatility. The lower band is tilted upwards.
- The RSI indicator is below 50. It has formed a positive divergence.
- The MACD indicator gives a bullish signal.
The bullish momentum may develop in case XAUAUD exceeds the last fractal high at 1588. This level may serve as an entry point. The initial stop loss may be placed below the last fractal low and the Parabolic signal at 1552. After opening the pending order, we shall move the stop to the next fractal low following the Bollinger and Parabolic signals. Thus, we are changing the potential profit/loss to the breakeven point. More risk-averse traders may switch to the 4-hour chart after the trade and place there a stop loss moving it in the direction of the trade. If the price meets the stop level at 1552 without reaching the order at 1588 we recommend cancelling the position: the market sustains internal changes that were not taken into account.
Summary of technical analysis
| Position | Buy |
| Buy stop | above 1588 |
| Stop loss | below 1552 |
Explore our
Trading Conditions
- Spreads from 0.0 pip
- 30,000+ Trading Instruments
- Stop Out Level - Only 10%
Ready to Trade?
Open Account Note:
This overview has an informative and tutorial character and is published for free. All the data, included in the overview, are received from public sources, recognized as more or less reliable. Moreover, there is no guarantee that the indicated information is full and precise. Overviews are not updated. The whole information in each overview, including opinion, indicators, charts and anything else, is provided only for familiarization purposes and is not financial advice or а recommendation. The whole text and its any part, as well as the charts cannot be considered as an offer to make a deal with any asset. IFC Markets and its employees under any circumstances are not liable for any action taken by someone else during or after reading the overview.
