- Analytics
- Technical Analysis
CORN Technical Analysis - CORN Trading: 2019-11-01
Slow US exports bearish for corn price
US corn export expectations are down. Will the corn prices continue declining?
US corn exports are off to a disappointing start. Unshipped corn sales for 2019-20 are at about 300 million bushels compared to over 500 million for 2018-19, According to US Department of Agriculture. Experts attribute it to the slow US harvest, and increased competition from big supplies out of Brazil. Expectations of lower export demand are bearish for corn prices.
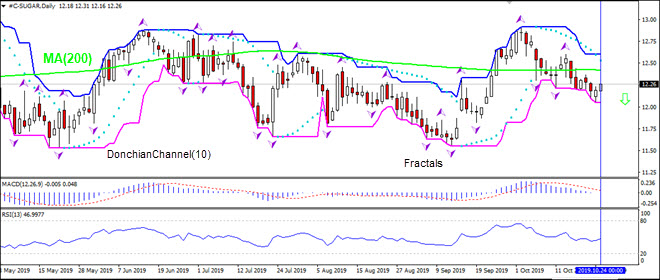
On the daily timeframe the CORN: D1 bounced off the 200-day moving average MA(200) which is level.
- The Parabolic indicator gives a sell signal.
- The Donchian channel indicates downtrend bias: it is narrowing down.
- The MACD indicator gives a bearish signal: it is above the signal line and the gap is narrowing.
- The RSI oscillator is falling but has not reached the oversold zone.
We believe the bearish momentum will continue after the price breaches below the lower boundary of Donchian channel at 388.4. This level can be used as an entry point for placing a pending order to sell. The stop loss can be placed above the last fractal high at 406.6. After placing the order, the stop loss is to be moved every day to the next fractal high, following Parabolic signals. Thus, we are changing the expected profit/loss ratio to the breakeven point. If the price meets the stop loss level (406.6) without reaching the order (388.4), we recommend cancelling the order: the market has undergone internal changes which were not taken into account.
Technical Analysis Summary
| Position | Sell |
| Sell stop | Below 388.4 |
| Stop loss | Above 406.6 |
Explore our
Trading Conditions
- Spreads from 0.0 pip
- 30,000+ Trading Instruments
- Stop Out Level - Only 10%
Ready to Trade?
Open Account Note:
This overview has an informative and tutorial character and is published for free. All the data, included in the overview, are received from public sources, recognized as more or less reliable. Moreover, there is no guarantee that the indicated information is full and precise. Overviews are not updated. The whole information in each overview, including opinion, indicators, charts and anything else, is provided only for familiarization purposes and is not financial advice or а recommendation. The whole text and its any part, as well as the charts cannot be considered as an offer to make a deal with any asset. IFC Markets and its employees under any circumstances are not liable for any action taken by someone else during or after reading the overview.
