- Analytics
- Technical Analysis
GBP/USD Technical Analysis - GBP/USD Trading: 2014-12-01
OPEC: dollar appreciation
The fallen oil futures prices after the OPEC meeting resulted in a significant depreciation of commodity currencies against the US dollar: it was in favour of USD and led to a significant strengthening of the dollar index. Today at 14:00 CET we expect the monthly release of ISM Manufacturing PMI in the United States. This diffusion index is based on a survey of 400 purchasing managers in the manufacturing industry, which evaluate employment, output volume, orders and stockpiles. It is the most important economic indicator as it permits obtaining preliminary information on manufacturing activity which affects the investor optimism. In our opinion, the greatest volatility is expected today from the US currency relative to other liquid instruments of the currency market.
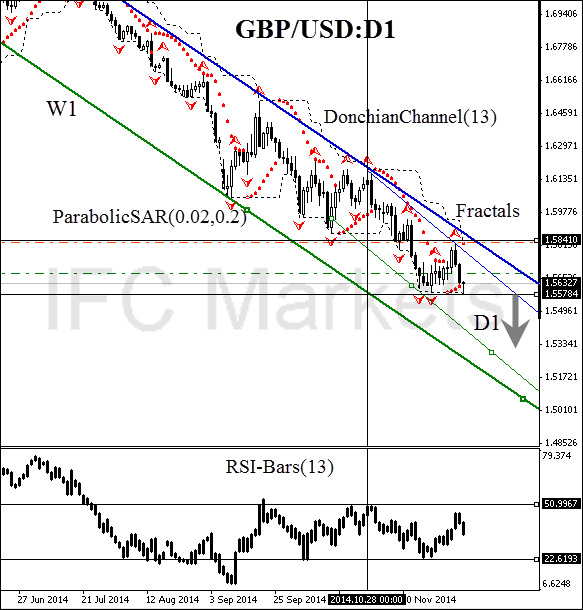
| Position | Sell |
| Sell stop | below 1.55784 |
| Stop loss | above 1.58410 |
Dear traders. For the detailed report of the strategy based on analytical issues of technical analysis click here.
Explore our
Trading Conditions
- Spreads from 0.0 pip
- 30,000+ Trading Instruments
- Stop Out Level - Only 10%
Ready to Trade?
Open Account Note:
This overview has an informative and tutorial character and is published for free. All the data, included in the overview, are received from public sources, recognized as more or less reliable. Moreover, there is no guarantee that the indicated information is full and precise. Overviews are not updated. The whole information in each overview, including opinion, indicators, charts and anything else, is provided only for familiarization purposes and is not financial advice or а recommendation. The whole text and its any part, as well as the charts cannot be considered as an offer to make a deal with any asset. IFC Markets and its employees under any circumstances are not liable for any action taken by someone else during or after reading the overview.
