- Analytics
- Technical Analysis
Nvidia Technical Analysis - Nvidia Trading: 2019-05-16
Lower sales expectations bearish for Nvidia price
Nvidia corporation is forecast to report first quarter revenue drop of over 30%. Will the Nvidia price continue declining?
Nvidia Corporation is expected to report first quarter revenue drop - more than 31% year over year to $2.2 billion. Among the reasons for the expected drop are weak graphics processing unit (GPU) demand and loss of Tesla business. NVIDIA's gaming business is its biggest source of revenue, accounting for about 43% of total sales. As a result, the company's earnings are expected to drop to $0.79 per share in the first quarter, down from $2.05 per share a year ago. Lower revenue forecast is bearish for Nvidia stock price. On the other hand, a surprise in the form of not such a sharp decline in revenue is an upside risk which might boost the stock price.
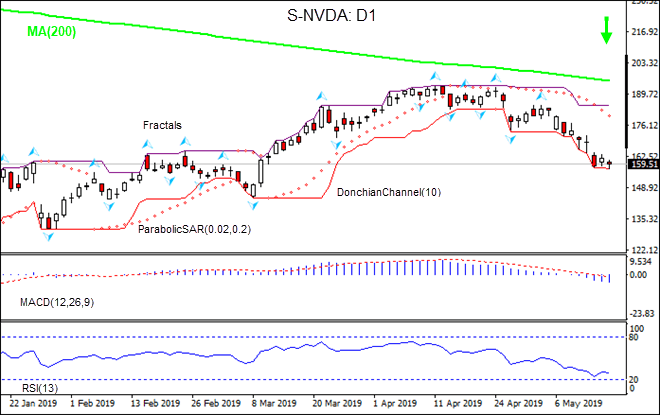
On the daily timeframe the S-NVDA: D1 is below the 200-day moving average MA(200) which is falling. This is bearish.
- The Parabolic indicator gives a sell signal.
- The Donchian channel indicates downtrend: it is tilted lower.
- The MACD indicator gives a bearish signal: it is below the signal line and the gap is widening.
- The RSI oscillator is falling but has not breached into the oversold zone yet.
We believe the bearish momentum will continue after the price breaches below the lower boundary of Donchian channel at 157.4. This level can be used as an entry point for placing a pending order to sell. The stop loss can be placed above the fractal high at 184.8. After placing the order, the stop loss is to be moved every day to the next fractal high, following Parabolic signals. Thus, we are changing the expected profit/loss ratio to the breakeven point. If the price meets the stop loss level (184.8) without reaching the order (157.4), we recommend cancelling the order: the market has undergone internal changes which were not taken into account.
Technical Analysis Summary
| Position | Sell |
| Sell stop | Below 157.4 |
| Stop loss | Above 184.8 |
Explore our
Trading Conditions
- Spreads from 0.0 pip
- 30,000+ Trading Instruments
- Stop Out Level - Only 10%
Ready to Trade?
Open Account Note:
This overview has an informative and tutorial character and is published for free. All the data, included in the overview, are received from public sources, recognized as more or less reliable. Moreover, there is no guarantee that the indicated information is full and precise. Overviews are not updated. The whole information in each overview, including opinion, indicators, charts and anything else, is provided only for familiarization purposes and is not financial advice or а recommendation. The whole text and its any part, as well as the charts cannot be considered as an offer to make a deal with any asset. IFC Markets and its employees under any circumstances are not liable for any action taken by someone else during or after reading the overview.
