- Analytics
- Technical Analysis
Stock portfolio in High-Tech industry Technical Analysis - Stock portfolio in High-Tech industry Trading: 2017-08-14
The US stock markets continue correcting
In this review, we suggest considering the personal composite instrument (PCI) "Technology_Stocks". It reflects the price dynamics of the portfolio from 10 stocks of the world's largest companies and the US high-tech industry traded on the US stock exchanges (NASDAQ, NYSE). The PCI declines when the stocks of the companies it includes fall in price. Is there a possibility for the Technology_Stocks to drop?
The main reason for the overall decline in the US stock market may be the continuing escalation of tension between the US and North Korea, called the "war of words" by market participants. In their opinion, there is still a rather high risk that the parties will move from words to action beginning military operations. An additional negative is the relatively weak quarterly reports of the remaining US companies. In particular, on Thursday, the stocks of Snap (-13%), J.C. Penney (-24.4%) and Nvidia (-8.6%) fell for this reason. The US inflation for July increased slightly, which may have a negative impact on the stock market.
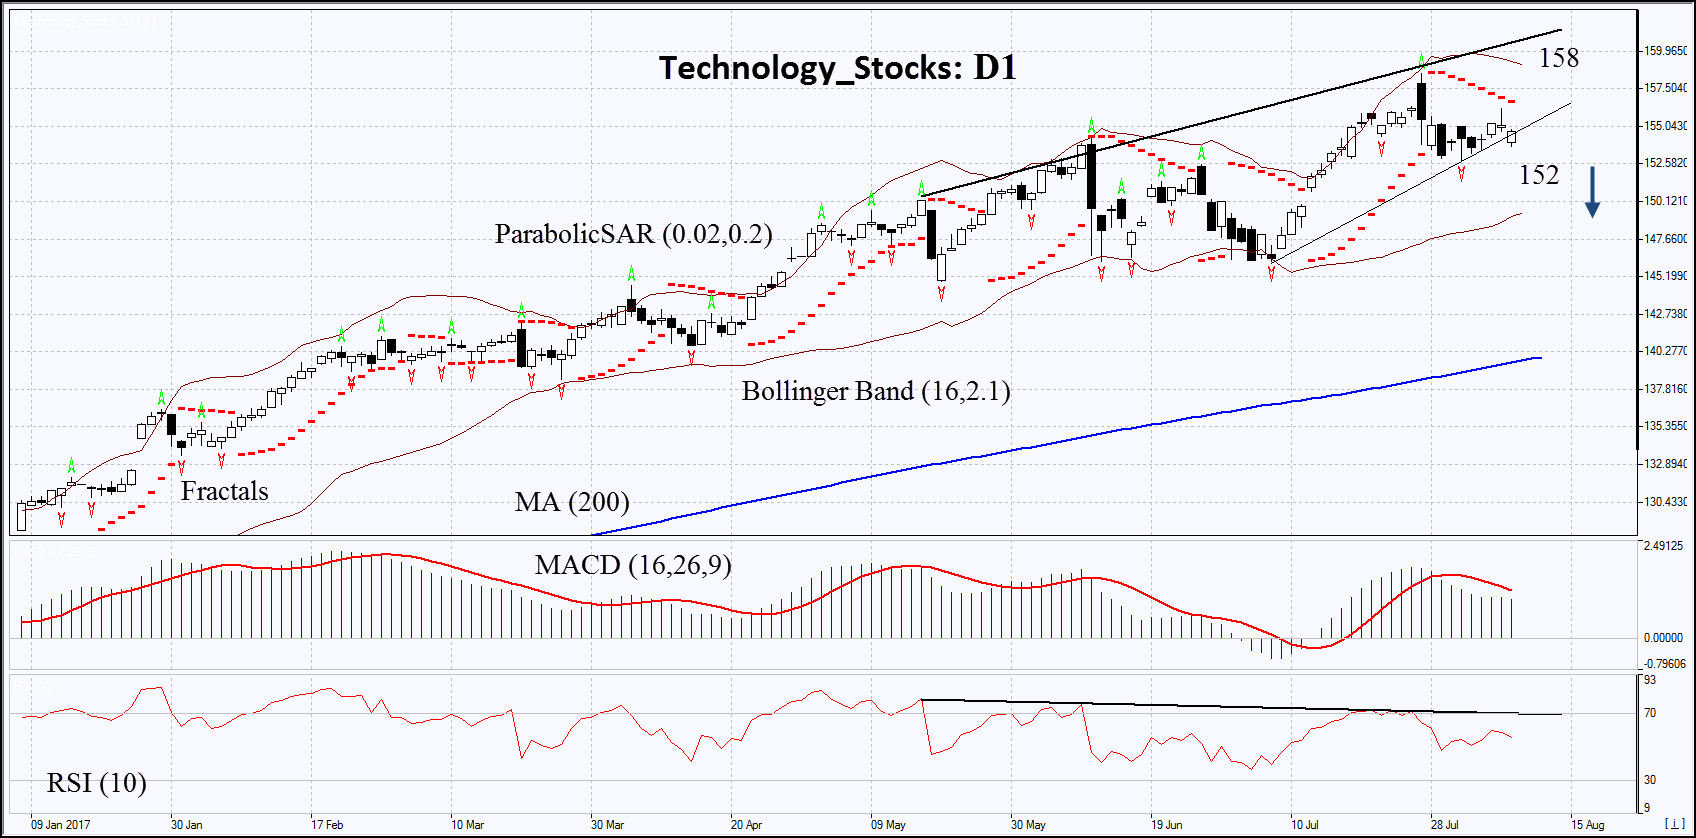
On the daily timeframe, Technology_Stocks: D1 came down from the rising trend. The downward correction is possible in case of the publication of negative economic and corporate information in the US.
- The Parabolic indicator gives a bearish signal.
- The Bollinger bands have narrowed, which means lower volatility.
- The RSI indicator is below 50. It has formed a negative divergence.
- The MACD indicator gives a bearish signal.
The bearish momentum may develop in case Technology_Stocks drops below the last fractal low at 152. This level may serve as an entry point. The initial stop loss may be placed above the 2nd fractal high, the historic high and the Parabolic signal at 158. After opening the pending order, we shall move the stop to the next fractal high following the Bollinger and Parabolic signals. Thus, we are changing the potential profit/loss to the breakeven point. More risk-averse traders may switch to the 4-hour chart after the trade and place there a stop loss moving it in the direction of the trade. If the price meets the stop level at 158 without reaching the order at 152 we recommend cancelling the position: the market sustains internal changes that were not taken into account.
Summary of technical analysis
| Position | Sell |
| Sell stop | below 152 |
| Stop loss | above 158 |
Explore our
Trading Conditions
- Spreads from 0.0 pip
- 30,000+ Trading Instruments
- Stop Out Level - Only 10%
Ready to Trade?
Open Account Note:
This overview has an informative and tutorial character and is published for free. All the data, included in the overview, are received from public sources, recognized as more or less reliable. Moreover, there is no guarantee that the indicated information is full and precise. Overviews are not updated. The whole information in each overview, including opinion, indicators, charts and anything else, is provided only for familiarization purposes and is not financial advice or а recommendation. The whole text and its any part, as well as the charts cannot be considered as an offer to make a deal with any asset. IFC Markets and its employees under any circumstances are not liable for any action taken by someone else during or after reading the overview.
