- Analytics
- Technical Analysis
BMW Technical Analysis - BMW Trading: 2019-06-06
Lower earnings bearish for BMW price
BMW stock has been declining after weaker than expected first quarter results. Will the BMW price continue declining?
BMW’s first-quarter operating profit fell 78%. The company forecast also weaker car sales in the first half of 2019, citing 36% jump in spending on property plants and equipment to 999 million euros in the first quarter as BMW prepares its factories to launch new vehicles like the 3-series and to build next generation electric and hybrid cars. Despite company's backing of its full year outlook of an increase in vehicle deliveries, shares fell 1.6% on the day a month ago BMW released its quarterly report. There has been no turnaround in company fortunes since then. Trade tensions between China and the United States do not subside, and possible development of US-EU trade disagreements is an additional downside risk for BMW stock price.
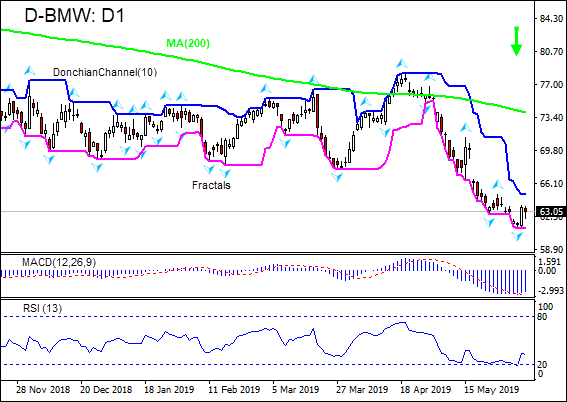
On the daily timeframe the D-BMW: D1 is below the 200-day moving average MA(200) which is falling. This is bearish.
- The Donchian channel indicates downtrend: it is tilted lower.
- The MACD indicator gives a bullish signal: it is below the signal line and the gap is narrowing.
- The RSI oscillator is rising after failing to breach into the oversold zone.
We believe the bearish momentum will continue after the price breaches below the lower boundary of Donchian channel at 61.14. This level can be used as an entry point for placing a pending order to sell. The stop loss can be placed above the fractal high at 64.91. After placing the order, the stop loss is to be moved every day to the next fractal high. Thus, we are changing the expected profit/loss ratio to the breakeven point. If the price meets the stop loss level (64.91) without reaching the order (61.14), we recommend cancelling the order: the market has undergone internal changes which were not taken into account.
Technical Analysis Summary
| Position | Sell |
| Sell stop | Below 61.14 |
| Stop loss | Above 64.91 |
Explore our
Trading Conditions
- Spreads from 0.0 pip
- 30,000+ Trading Instruments
- Stop Out Level - Only 10%
Ready to Trade?
Open Account Note:
This overview has an informative and tutorial character and is published for free. All the data, included in the overview, are received from public sources, recognized as more or less reliable. Moreover, there is no guarantee that the indicated information is full and precise. Overviews are not updated. The whole information in each overview, including opinion, indicators, charts and anything else, is provided only for familiarization purposes and is not financial advice or а recommendation. The whole text and its any part, as well as the charts cannot be considered as an offer to make a deal with any asset. IFC Markets and its employees under any circumstances are not liable for any action taken by someone else during or after reading the overview.
