- Analytics
- Technical Analysis
DJIA Technical Analysis - DJIA Trading: 2018-02-08
Dow Jones: Slump or Reversal?
Strong jobs and inflation data precipitated market selloff on Monday. Will the DJI stock index slump continue?
The Dow Jones industrial average tumbled 4.6% on Monday, entering correction territory with a 10% decline from the January 26 record high. The stock market retreat was triggered by a better than expected January jobs report on Friday. The Bureau of Labor Statistics reported 200 thousand increase in nonfarm payrolls in January following the 148 thousand gain in December. The increase in jobs was higher than expected, but more importantly it was accompanied by 2.9% increase in average hourly earnings year-over-year in January from 2.7% in December. The increase in wages is considered an indicator of tightening in labor market, which should cause inflation that monetary authorities are mandated to contain. The strong labor market report was seen as providing support to views the Federal Reserve may not just stick to previously indicated plan of three rate hikes in 2018 but actually implement four rate hikes. Recent rise in Treasury yields indicates that market participants expect the Federal Reserve will continue monetary policy tightening, and the yield on 10-year Treasury note hit 2.883% Monday. The uptick in personal consumption expenditures index, Federal Reserve’s preferred gauge of inflation, also provides support for the view tight labor market is contributing to the rise in inflation. The ICE US dollar index actually gained 0.3% on the Bureau of Economic Analysis report January 28 the core personal consumption expenditure index rose 0.2% on month in December from 0.1% the previous month. And the dollar index gained 0.6% last Friday on unexpectedly good jobs report. Continued strengthening of the dollar, after it recorded last week the first weekly gain since mid-December, is another indicator signaling market participants expect monetary authorities will fasten the pace of rate hikes. The loosening of monetary policy implemented through successive Quantitative Easing programs by the Federal Reserve has been the major contributor to the stock market recovery and rally since 2008 financial crisis. President Trump’s pledges of fiscal stimulus programs like tax cuts and infrastructure spending programs also contributed to the recent leg of the US stock market rally. And there is no wonder the stock market is reacting at last to shift to monetary tightening in the Federal Reserve monetary policy stance.
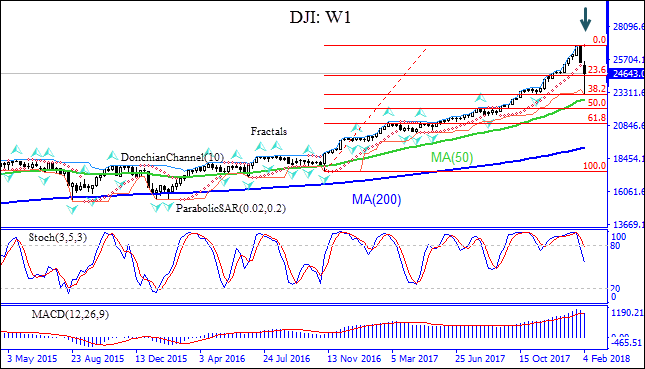
On the weekly timeframe DJI: W1 has hit the Fibonacci retracement level 38.2 counted from the fractal low of the 2016 US presidential election. The price is still above the 50-week moving average MA(50).
- The Donchian channel indicates downtrend: it is tilted down.
- The Parabolic indicator has formed a sell signal.
- The MACD indicator is above the signal line and the gap is narrowing, which is a bearish signal.
- The stochastic oscillator is falling but has not reached the oversold zone.
We believe the bearish momentum will continue after the price closes below the Fibonacci retracement level 38.2, confirmed also by the lower bound of the Donchian channel at 23127. This level can be used as an entry point for placing a pending order to sell. The stop loss can be placed above the upper Donchian bound at 26681. After placing the order, the stop loss is to be moved every day to the next fractal high, following Parabolic signals. Thus, we are changing the probable profit/loss ratio to the breakeven point. If the price meets the stop loss level (26681) without reaching the order (23127), we recommend cancelling the order: the market has undergone internal changes which were not taken into account.
Technical Analysis Summary
| Position | Sell |
| Sell stop | Below 23127 |
| Stop loss | Above 26681 |
Explore our
Trading Conditions
- Spreads from 0.0 pip
- 30,000+ Trading Instruments
- Stop Out Level - Only 10%
Ready to Trade?
Open Account Note:
This overview has an informative and tutorial character and is published for free. All the data, included in the overview, are received from public sources, recognized as more or less reliable. Moreover, there is no guarantee that the indicated information is full and precise. Overviews are not updated. The whole information in each overview, including opinion, indicators, charts and anything else, is provided only for familiarization purposes and is not financial advice or а recommendation. The whole text and its any part, as well as the charts cannot be considered as an offer to make a deal with any asset. IFC Markets and its employees under any circumstances are not liable for any action taken by someone else during or after reading the overview.
