- Analytics
- Technical Analysis
EUR/NZD Technical Analysis - EUR/NZD Trading: 2018-10-17
The meeting of the US and Chinese presidents at the G20 summit will could reduce the risks of world trade wars
In this review, we will consider the trading instrument the euro against the New Zealand dollar. Will the EURNZD decrease? The downward movement occurs when the New Zealand dollar quotes rise, and the euro weakens.
China is New Zealand’s main trading partner. The expected meeting of the presidents of the United States and China at the end of November may reduce the risks in world trade. This is a positive factor for the currency of New Zealand. The rate of the Reserve Bank of New Zealand is positive and amounts to + 1,75% with an annual inflation of + 1,5% in the 2nd quarter of the current year. The rate of the ECB is equal to zero at annual inflation of +2,1%. The noticeable difference in rates can become one of factors of decreasing in EURNZD quotes. The euro is adversely affected by the budget crisis in Italy. Meanwhile, similar economic problems may also appear in Spain.
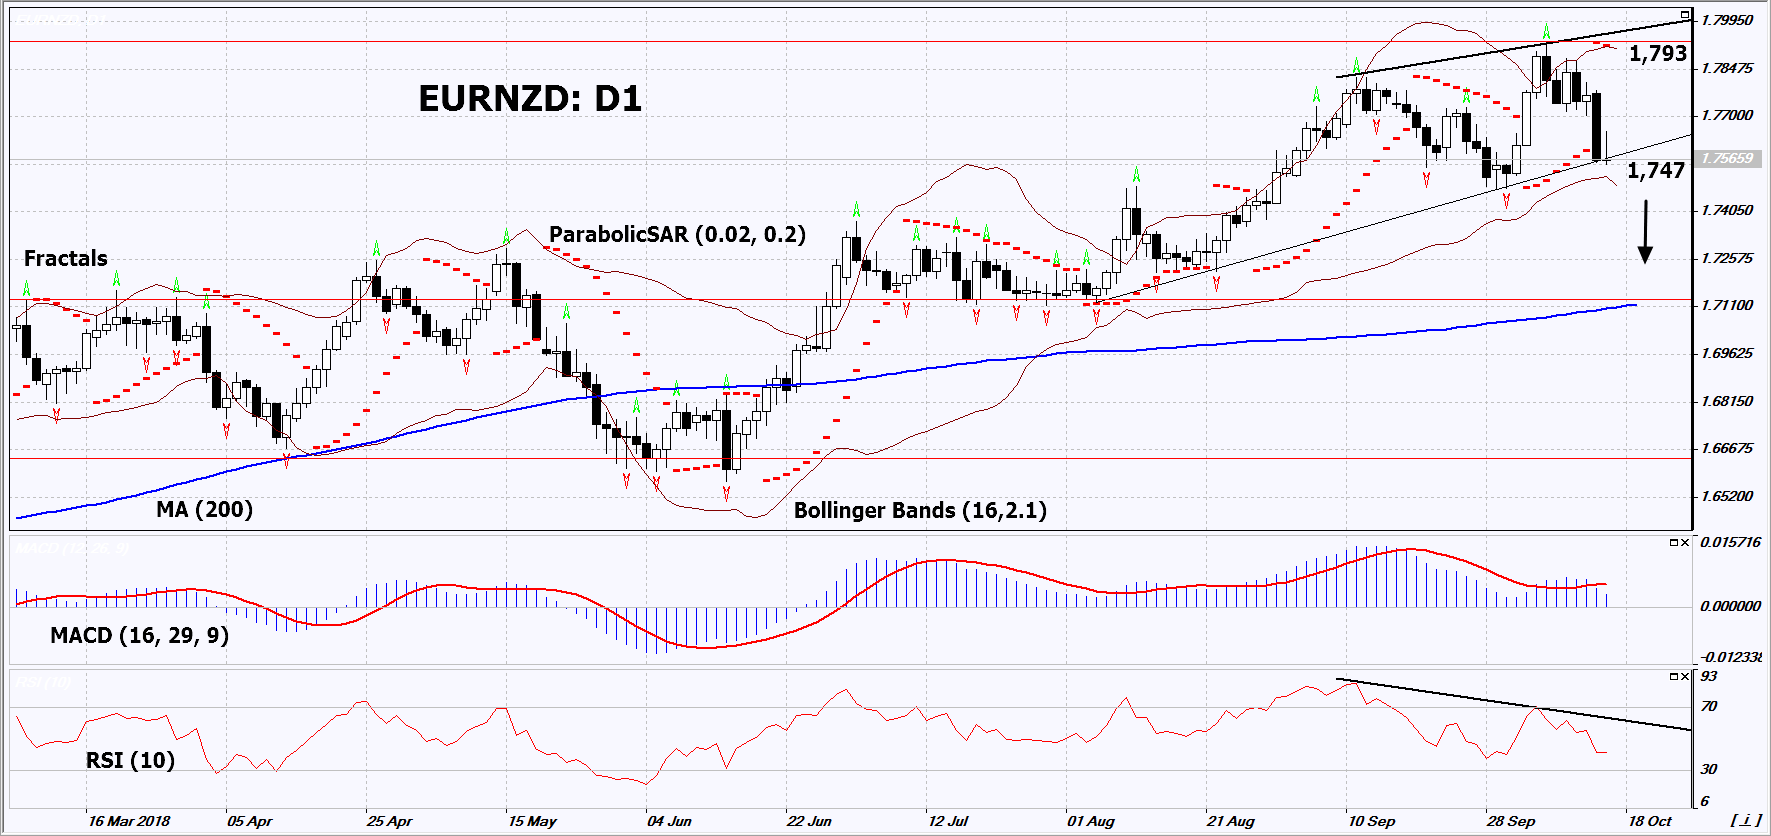
On the daily timeframe, EURNZD: D1 is trying to correct down from its 3-year high. However, its growth slowed down and some indicators of technical analysis formed signals for lowering. Downward correction may be caused by negative macroeconomic data in the EU and positive data in New Zealand.
- The Parabolic indicator gives a bearish signal.
- TheBollinger bands have narrowed, which indicates low volatility. They are titled downward.
- The RSI indicator is below 50. It has formed a negative divergence.
- The MACD indicator gives bearish signals.
The bearish momentum may develop in case EURNZDfalls below its last fractal low and lower boundary Bollinger band at 1,747. This level may serve as an entry point. The initial stop loss may be placed above the last fractal highs, the 3-year high, the upper Bollinger band and the Parabolic signal at 1,793. After opening the pending order, we shall move the stop to the next fractal high following the Bollinger and Parabolic signals. Thus, we are changing the potential profit/loss to the breakeven point. More risk-averse traders may switch to the 4-hour chart after the trade and place there a stop loss moving it in the direction of the trade. If the price meets the stop level (1,793) without reaching the order (1,747), we recommend to close the position: the market sustains internal changes that were not taken into account.
Summary of technical analysis
| Position | Sell |
| Sell stop | Below 1,747 |
| Stop loss | Above 1,793 |
Explore our
Trading Conditions
- Spreads from 0.0 pip
- 30,000+ Trading Instruments
- Stop Out Level - Only 10%
Ready to Trade?
Open Account Note:
This overview has an informative and tutorial character and is published for free. All the data, included in the overview, are received from public sources, recognized as more or less reliable. Moreover, there is no guarantee that the indicated information is full and precise. Overviews are not updated. The whole information in each overview, including opinion, indicators, charts and anything else, is provided only for familiarization purposes and is not financial advice or а recommendation. The whole text and its any part, as well as the charts cannot be considered as an offer to make a deal with any asset. IFC Markets and its employees under any circumstances are not liable for any action taken by someone else during or after reading the overview.
