- Analytics
- Technical Analysis
Hang Seng (HSI) Technical Analysis - Hang Seng (HSI) Trading: 2019-01-10
Improving Hong Kong data bullish for HK50
Contraction in Hong Kong business sector slowed in December. Will the HK50 continue rising?
Latest Hong Kong economic data were positive: the Foreign Exchange Reserves in Hong Kong increased to $424.6 billion in December from 423.2 billion in November. In Hong Kong, Foreign Exchange Reserves are the foreign assets, besides gold and foreign currencies, controlled by the country’s central bank. They hit all time high of $443.4 billion in February of 2018. At the same time contraction in private sector slowed as indicated by the up-tick in Nikkei’s Purchasing Managers’ Index to 48 from 47.1. Improving economic data are bullish for Hong Kong stock index.
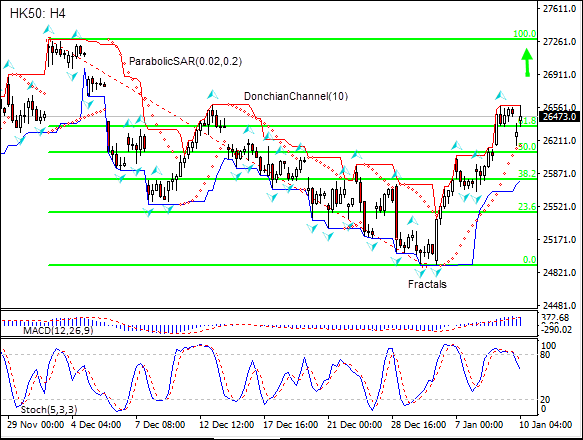
On the 4-hour timeframe the HK50: H4 is above the 61.8 Fibonacci level, this is bullish.
- The Parabolic indicator gives a buy signal.
- The Donchian channel indicates uptrend: it is widening up.
- The MACD indicator gives a bearish signal: it is above the signal line and the gap is narrowing.
- The Stochastic oscillator is falling but has not reached the oversold zone.
We believe the bullish momentum will continue after the price closes above the upper boundary of Donchian channel at 26579.7. This level can be used as an entry point for placing a pending order to buy. The stop loss can be placed below the lower Donchian boundary at 25810.4. After placing the order, the stop loss is to be moved every day to the next fractal low, following Parabolic signals. Thus, we are changing the expected profit/loss ratio to the breakeven point. If the price meets the stop loss level (25810.4) without reaching the order (26579.7), we recommend cancelling the order: the market has undergone internal changes which were not taken into account.
Technical Analysis Summary
| Position | Buy |
| Buy stop | Above 26579.7 |
| Stop loss | Below 25810.4 |
Explore our
Trading Conditions
- Spreads from 0.0 pip
- 30,000+ Trading Instruments
- Stop Out Level - Only 10%
Ready to Trade?
Open Account Note:
This overview has an informative and tutorial character and is published for free. All the data, included in the overview, are received from public sources, recognized as more or less reliable. Moreover, there is no guarantee that the indicated information is full and precise. Overviews are not updated. The whole information in each overview, including opinion, indicators, charts and anything else, is provided only for familiarization purposes and is not financial advice or а recommendation. The whole text and its any part, as well as the charts cannot be considered as an offer to make a deal with any asset. IFC Markets and its employees under any circumstances are not liable for any action taken by someone else during or after reading the overview.
