- Analytics
- Technical Analysis
Natural Gas Prices Technical Analysis - Natural Gas Prices Trading: 2017-09-20
Recovery from hurricane consequences may increase the demand for electricity
In the US, the consequences of Harvey and Irma hurricanes are being eliminated. In particular, the electricity supply is restored, which may increase the demand for electricity. Will the natural gas prices increase?
On Tuesday, in the US state of Florida, 98% of consumers, previously deprived of electricity because of the destruction caused by Hurricane Irma, were connected. In the US, approximately 30% of electricity is generated by gas thermal power plants. An additional factor in increasing the demand for American natural gas may be an increase in its exports, including in the form of LNG. In August, the shipping from the Sabine Pass LNG terminal reached its historic high. This week, the volume of the US natural gas exports reached 8.6 bln cubic feet, which is by 65% more than in the same week of the last year. Rising oil prices also contribute to the increase of natural gas prices.
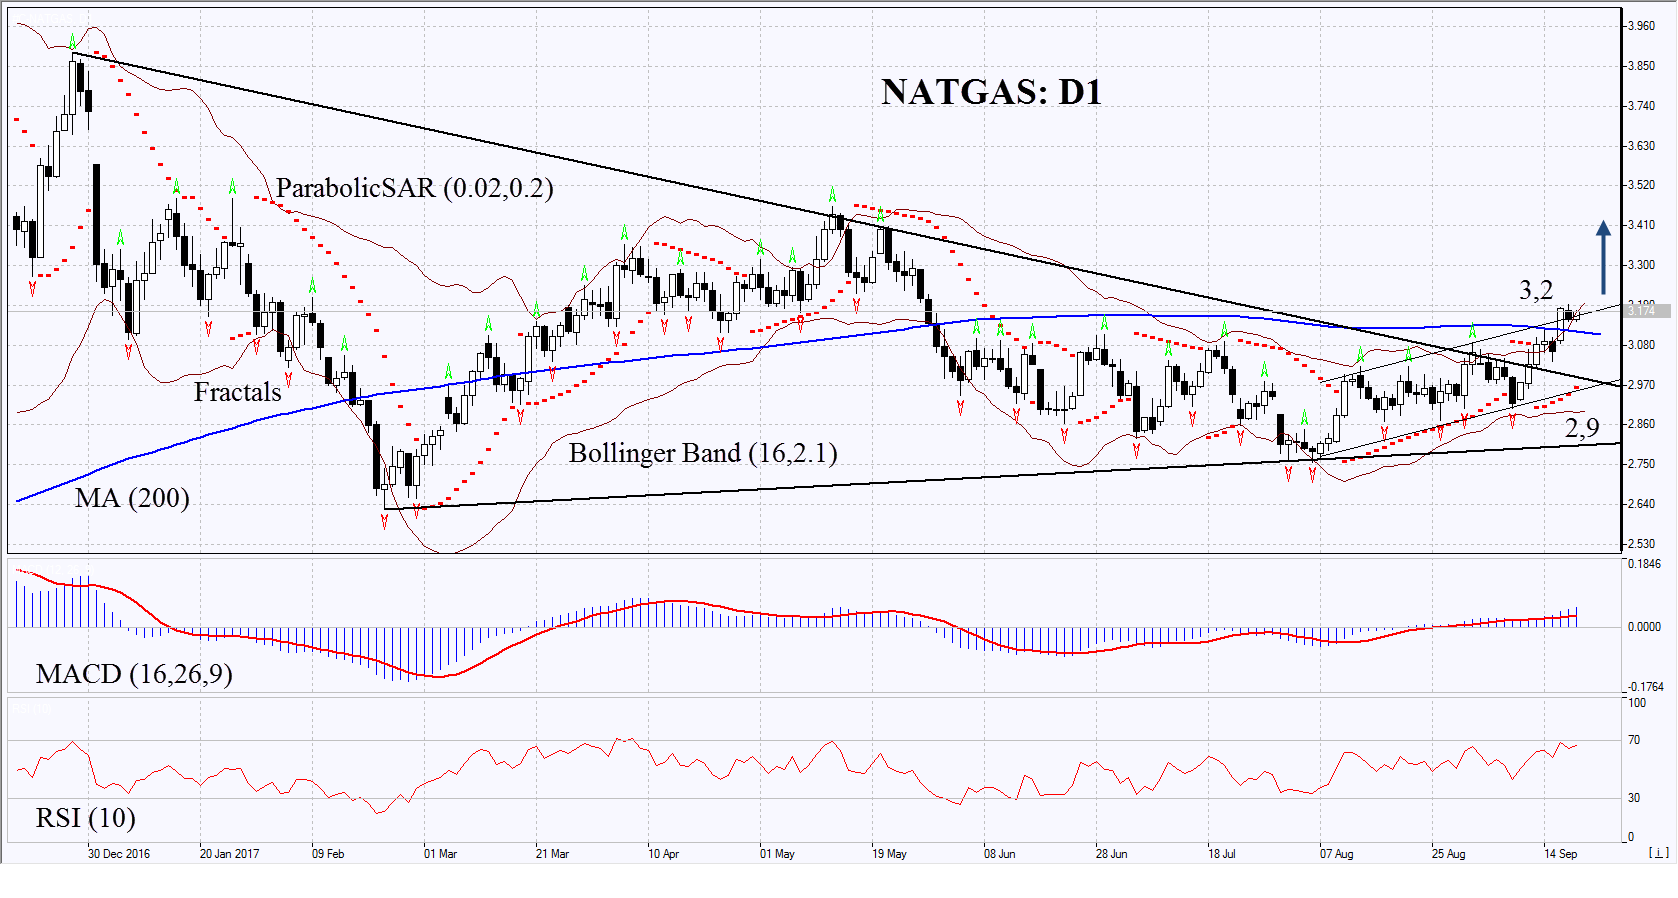
On the daily timeframe, NATGAS: D1 went up from the triangle and exceeded the 200-day moving average line. The further price increase is possible in case the demand for the US natural gas increases in national and global markets.
- The Parabolic indicator gives a bullish signal.
- The Bollinger bands have widened, which means higher volatility. They are tilted upwards.
- The RSI indicator is above 50. No divergence.
- The MACD indicator gives a bullish signal.
The bullish momentum may develop in case NATGAS exceeds the previous high and the upper Bollinger band at 3.2. This level may serve as an entry point. The initial stop loss may be placed below the support line of the rising channel and the Parabolic signal at 2.9. After opening the pending order, we shall move the stop to the next fractal low following the Bollinger and Parabolic signals. Thus, we are changing the potential profit/loss to the breakeven point. More risk-averse traders may switch to the 4-hour chart after the trade and place there a stop loss moving it in the direction of the trade. If the price meets the stop level at 2.9 without reaching the order at 3.2 we recommend cancelling the position: the market sustains internal changes that were not taken into account.
Summary of technical analysis
| Position | Buy |
| Buy stop | above 3,2 |
| Stop loss | below 2,9 |
Explore our
Trading Conditions
- Spreads from 0.0 pip
- 30,000+ Trading Instruments
- Stop Out Level - Only 10%
Ready to Trade?
Open Account Note:
This overview has an informative and tutorial character and is published for free. All the data, included in the overview, are received from public sources, recognized as more or less reliable. Moreover, there is no guarantee that the indicated information is full and precise. Overviews are not updated. The whole information in each overview, including opinion, indicators, charts and anything else, is provided only for familiarization purposes and is not financial advice or а recommendation. The whole text and its any part, as well as the charts cannot be considered as an offer to make a deal with any asset. IFC Markets and its employees under any circumstances are not liable for any action taken by someone else during or after reading the overview.
