- Analytics
- Technical Analysis
NZD/USD Technical Analysis - NZD/USD Trading: 2017-07-21
New Zealand dollar strengthens with rising exports
The New Zealand dollar is rising with strong demand of country’s exports. Will the New Zealand dollar continue strengthening?
The Reserve Bank of New Zealand kept the official cash rate (OCR) on hold at 1.75% at its June 22 meeting. The bank said the growth outlook remained positive, supported by accommodative monetary policy, strong population growth, and high terms of trade. Statistics New Zealand reported New Zealand's merchandise exports rose 8.7%, led by dairy exports, to highest level in more than three years in May. Exports of dairy products to China increased the most in values. Dairy sector remains New Zealand’s biggest export earner accounting for 23.7% of total exports. Imports rose 15%, led by crude oil shipments. Rising exports and import indicate economic strength. Dairy prices rose at latest Global Dairy Trade auction after tow declines as prices started rising since March this year. Chinas economic growth remained at robust 6.9%, within the government’s 6.5% - 7% target range. Asian economies are forecast to remain among the fastest growing in the world. Asia accounts for more than half of New Zealand’s dairy exports. The outlook for dairy prices and New Zealand’s exports are positive as demand for country’s dairy exports is expected to increase with economic growth in export markets. Expected growth in exports is positive for New Zealand’s currency.
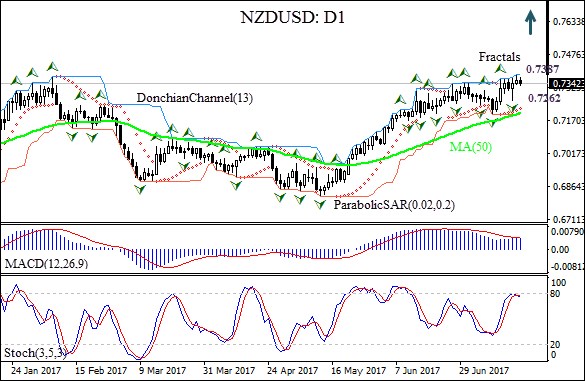
The NZDUSD: D1 has been correcting upward since hitting 12-month low in the beginning of May on the daily chart. The price is above the 50-day moving average MA(50) which is rising.
- The Parabolic indicator gives a buy signal.
- The Donchian channel indicates uptrend: it is tilted upward.
- The MACD indicator is neutral.
- The stochastic oscillator has reached the boundary of the overbought zone.
We believe the bullish momentum will continue after the price closes above the upper Donchian boundary at 0.7387. A pending order to buy can be placed above that level. The stop loss can be placed below the last fractal low at 0.7262. After placing the order, the stop loss is to be moved every day to the next fractal low, following Parabolic signals. Thus, we are changing the probable profit/loss ratio to the breakeven point. The most risk-averse traders may switch to the 4-hour chart after the trade and place there a stop-loss moving it in the direction of the trade. If the price meets the stop loss level (0.7262) without reaching the order (0.7387), we recommend canceling the position: the market sustains internal changes which were not taken into account.
Technical Analysis Summary
| Position | Buy |
| Buy stop | Above 0.7387 |
| Stop loss | Below 0.7262 |
- Get Certificate

Note:
This overview has an informative and tutorial character and is published for free. All the data, included in the overview, are received from public sources, recognized as more or less reliable. Moreover, there is no guarantee that the indicated information is full and precise. Overviews are not updated. The whole information in each overview, including opinion, indicators, charts and anything else, is provided only for familiarization purposes and is not financial advice or а recommendation. The whole text and its any part, as well as the charts cannot be considered as an offer to make a deal with any asset. IFC Markets and its employees under any circumstances are not liable for any action taken by someone else during or after reading the overview.
