- Analytics
- Technical Analysis
WTI Crude Oil Technical Analysis - WTI Crude Oil Trading: 2017-03-28
Rigs count increase does not markedly affect oil prices so far
The active rigs count is constantly advancing in the US while oil prices remain at the same relatively high level with barely rising production volumes. Will WTI prices advance?
The active rigs count rose in US by 20 units in a week to March 24, 2017, according to Baker Hughes oil service company. This is their record increase since this January. Rigs count has been rising for 10 straight weeks having reached 652 units. The US rigs count was just 372 a year ago on March 24, 2016. At the same time, WTI oil cost $40 a barrel versus $47.7 now. Thus, higher rigs count not only does not weigh on prices but WTI manages to get dearer. This is quite real in case of depletion of shale field in US and, agreeably, in case of lower production volumes.
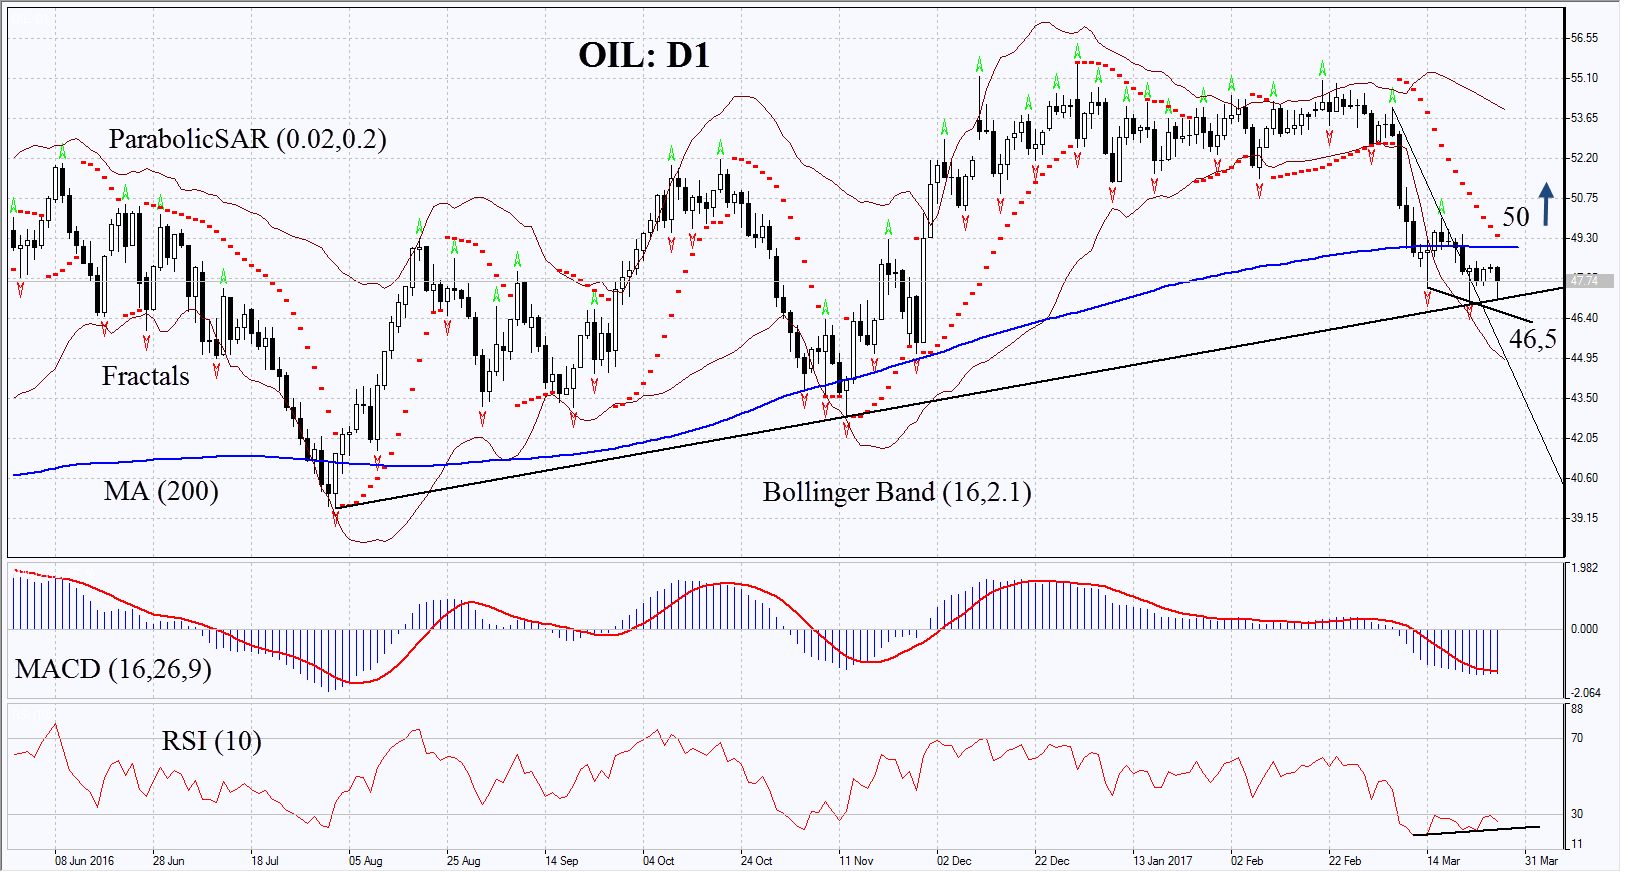
On the daily chart OIL: D1 has reached the support of the rising trend and is struggling to bounce up from it. The further price increase is possible in case of low production increase in US and maintained limit of OPEC oil production.
- The Parabolic indicator gives bearish signal. It may serve the additional level of resistance which has to be overcome to open long position.
- The Bollinger bands have widened a lot which manes high volatility.
- The RSI is in the oversold zone. It has formed positive divergence.
- The MACD gives bullish signal.
The bullish momentum may develop in case OIL surpasses the last fractal high, 200-day moving average and the Parabolic signal at 50. This level may serve the point of entry. The initial stop-loss may be placed below the last fractal low at 46.5. Having opened the pending order we shall move the stop to the next fractal low following the Parabolic and Bollinger signals. Thus, we are changing the probable profit/loss ratio to the breakeven point. The most risk-averse traders may switch to the 4-hour chart after the trade and place there a stop-loss moving it in the direction of the trade. If the price meets the stop-loss level at 46.5 without reaching the order at 50, we recommend cancelling the position: the market sustains internal changes which were not taken into account.
Summary of technical analysis
| Position | Buy |
| Buy stop | above 50 |
| Stop loss | below 46.5 |
Explore our
Trading Conditions
- Spreads from 0.0 pip
- 30,000+ Trading Instruments
- Stop Out Level - Only 10%
Ready to Trade?
Open Account Note:
This overview has an informative and tutorial character and is published for free. All the data, included in the overview, are received from public sources, recognized as more or less reliable. Moreover, there is no guarantee that the indicated information is full and precise. Overviews are not updated. The whole information in each overview, including opinion, indicators, charts and anything else, is provided only for familiarization purposes and is not financial advice or а recommendation. The whole text and its any part, as well as the charts cannot be considered as an offer to make a deal with any asset. IFC Markets and its employees under any circumstances are not liable for any action taken by someone else during or after reading the overview.
