- Analytics
- Technical Analysis
Technical Analysis - Trading: 2014-10-14
Brazilian Partition
Good afternoon, dear investors. Today we consider the spread instrument which discloses the internal structure of the Brazilian economy: №1 state by GDP absolute value in Latin America. One third of the Brazilian GDP accounts for the industrial sector, which is traditionally dependent on energy prices. Energy market in Brazil is almost fully controlled by the Petryleo Brasileiro (Petrobras) corporation: the main shareholder is the Government of Brazil which owns more than 32% of capitalization. The company is currently the dominant player in the oil and gas sector, as it controls more than 95% of crude production and 90% of natural gas reserves in Brazil. Moreover, Petrobras owns completely the oil and gas transmission network in Brazil and 11 oil refineries. Unfortunately, there is no more good news for PBR. Since 2010 together with the Brazilian economy recovery, energy shortages continue to increase. At the moment the country’s oil shortage is more than 670 thousand barrels per year, while imports continue to increase. However, exports decreased: there was a significant drop of 13% in 2012.
Additional restrictions are defined by social aspect of the state policy. Since 2011 the government has still kept domestic energy prices lower than global prices, as you can see on the figure below. The gap of “social support” is marked in red. Therefore, the net revenues of the company continue to fall as imports and oil price decrease. Thus, PBR reduced the net profit by 12% in the Q3 2014, compared to the same period last year, to 5.57 billion Brazilian reals ($2.7 billion). In terms of macroeconomic indicators, it does not have any serious consequences. Note that the Brazilian economy recovery is influenced by rising prices on agricultural products, which make up more than 20% of Brazilian exports.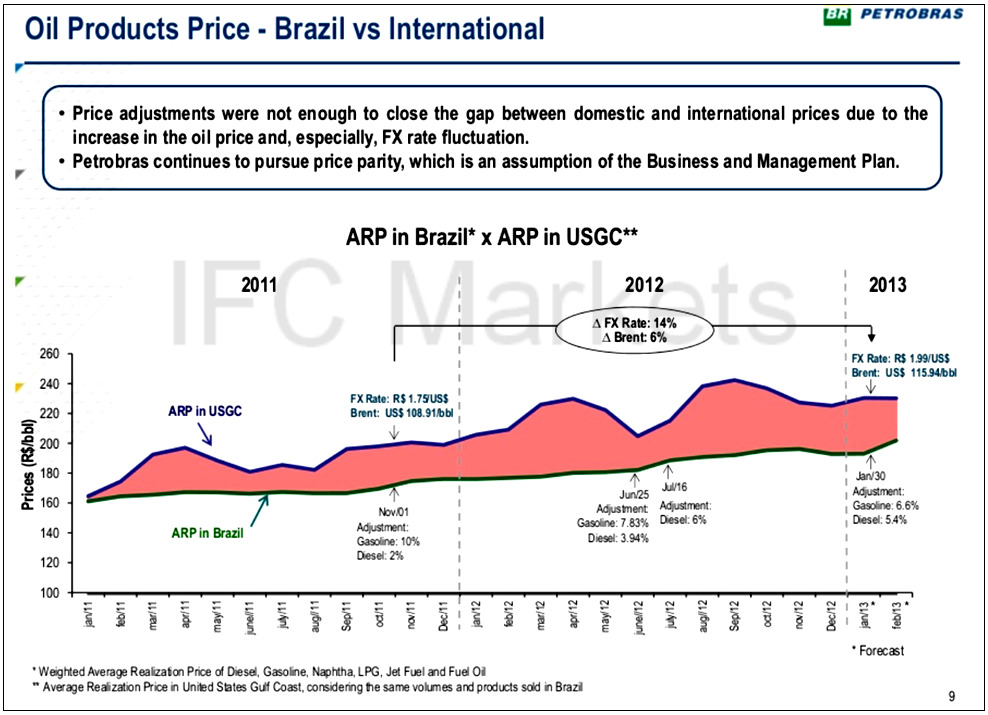
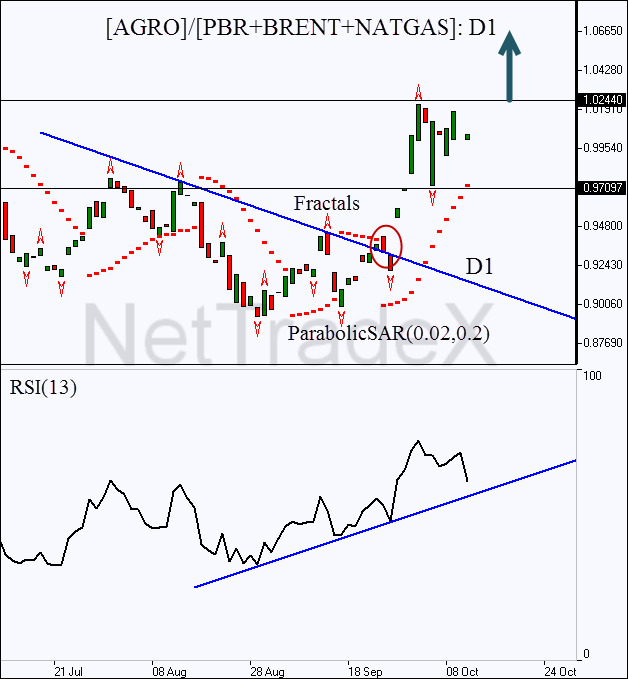
To make visible the regularities described above, we have compiled portfolio spread instrument in NetTradeX platform: [SOYB + SUGAR + COFFEE + CORN + F-CATTLE]/[PBR + BRENT + NATGAS]. The composite instrument is based on quoting the portfolio of continuous agricultural futures (soybeans, sugar, coffee, corn and frozen beef) against the energy sector portfolio: Petrobras stocks, futures on Brent and natural gas. Note that the price of each of the assets included in the paired instrument is calculated automatically in US dollars by the program. The purchasing of the portfolio spread is equal to buying the basic portfolio SOYB(20%) + SUGAR(20%) + COFFEE(20%) + CORN(20%) + F-CATTLE(20%) and simultaneously selling the “energy portfolio” based on the currency cross-rate model. Assets of the quoted portfolio have the same weight of the capital invested: PBR(33%) + BRENT(33%) + NATGAS(33%).
More information about the mechanism of portfolio operations is available on our website section “Quick Guide for Creating and Trading PCI”.
Explore our
Trading Conditions
- Spreads from 0.0 pip
- 30,000+ Trading Instruments
- Stop Out Level - Only 10%
Ready to Trade?
Open Account Note:
This overview has an informative and tutorial character and is published for free. All the data, included in the overview, are received from public sources, recognized as more or less reliable. Moreover, there is no guarantee that the indicated information is full and precise. Overviews are not updated. The whole information in each overview, including opinion, indicators, charts and anything else, is provided only for familiarization purposes and is not financial advice or а recommendation. The whole text and its any part, as well as the charts cannot be considered as an offer to make a deal with any asset. IFC Markets and its employees under any circumstances are not liable for any action taken by someone else during or after reading the overview.
