- Analytics
- Technical Analysis
Rice Investments Technical Analysis - Rice Investments Trading: 2017-07-24
Increase in the world supply of rice
China is selling rice reserves of the 2013 harvest from its state reserves. Will the rice prices fall?
On Wednesday, July 19, 2017, the Chinese National Grain Trade Center announced the sale of 124.8 thousand tonnes of rice from the state reserves. This volume is 7.7% of the 1.62 mln tonnes declared at the auction. The rice sale from the Chinese state reserves will continue. In the 2017/18 agricultural season, India increased the planting acreage of rice to 12.58 mln hectares, which is by 4.6% more than in the previous season. Note that last week the rice prices dropped by about 5% in India and Thailand. This is connected with the reduction in global demand and competition with other producer countries. In particular, Vietnam increased the rice exports by 10.3% to 2.9 mln tonnes in the first half of this year. Egypt expects an increase in rice crops to 6.5 mln tonnes this year, compared with 5.1 mln tonnes of the last year. The main buyers of rice in Southeast Asia are the Philippines, Bangladesh, Sri Lanka.
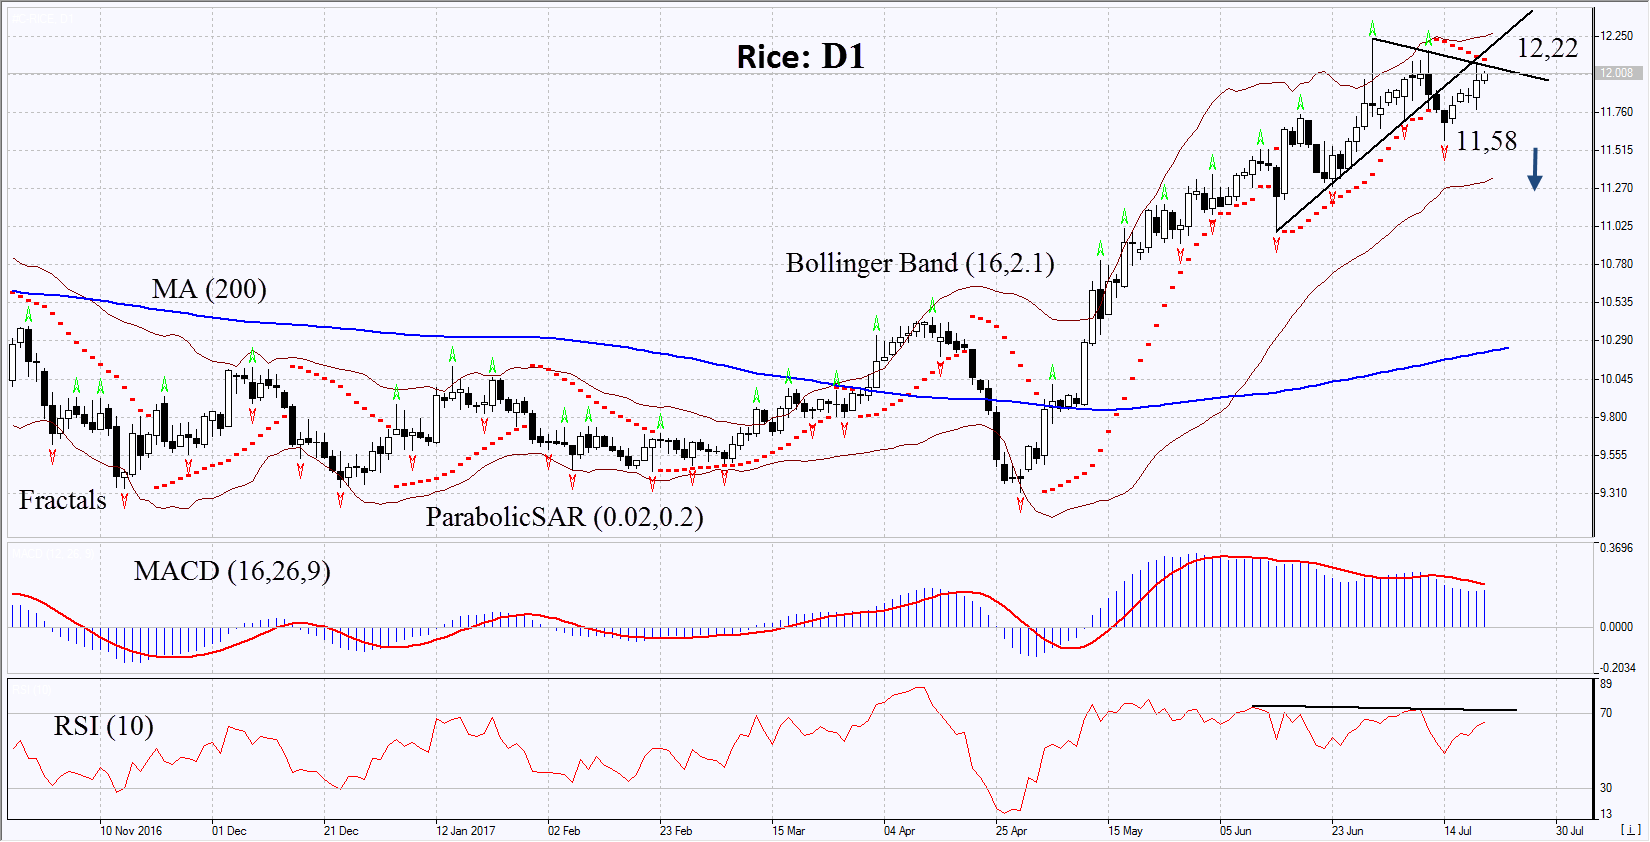
On the daily timeframe, Rice: D1 is trying to return to the rising price channel. The continuation of the downward correction is possible in case of an increase in rice supply in the world market.
- The Parabolic indicator gives a bearish signal.
- The Bollinger bands have widened, which means high volatility.
- The RSI is above 50. It has formed a weak negative divergence.
- The MACD gives a bearish signal.
The bearish momentum may develop in case Rice drops below the last low at 11.58. This level may serve as an entry point. The initial stop loss may be placed above the two last fractal highs, the Parabolic signal and the record high since November, 2015 at 12.22. After opening the pending order, we shall move the stop to the next fractal high following the Bollinger and Parabolic signals. Thus, we are changing the potential profit/loss to the breakeven point. More risk-averse traders may switch to the 4-hour chart after the trade and place there a stop loss moving it in the direction of the trade. If the price meets the stop level at 12.22 without reaching the order at 11.58 we recommend cancelling the position: the market sustains internal changes that were not taken into account.
Summary of technical analysis
| Position | Sell |
| Sell stop | below 11,58 |
| Stop loss | above 12,22 |
Explore our
Trading Conditions
- Spreads from 0.0 pip
- 30,000+ Trading Instruments
- Stop Out Level - Only 10%
Ready to Trade?
Open Account Note:
This overview has an informative and tutorial character and is published for free. All the data, included in the overview, are received from public sources, recognized as more or less reliable. Moreover, there is no guarantee that the indicated information is full and precise. Overviews are not updated. The whole information in each overview, including opinion, indicators, charts and anything else, is provided only for familiarization purposes and is not financial advice or а recommendation. The whole text and its any part, as well as the charts cannot be considered as an offer to make a deal with any asset. IFC Markets and its employees under any circumstances are not liable for any action taken by someone else during or after reading the overview.
