- Analytics
- Technical Analysis
S&P 500 Technical Analysis - S&P 500 Trading: 2016-02-16
Strong retail sales supported index
The US stock exchanges were closed on Monday due to the holiday – the President’s Day. Nevertheless, the stock index futures were traded. Their positive dynamics is depicted in the CDF on S&P 500 chart. Investors await the US stock market growth supported by the increased January retail sales released on Friday. Will S&P 500 continue advancing?
The core retail sales, excluding automobiles, gasoline, building materials and food, rose 0.6% in January. As private consumption accounts for 2/3 of the US GDP, several investment banks have revised up its growth outlook for Q1. For instance, Morgan Stanley bank has revised up the estimate from 1.2% to 1.5%. This week the core economic data will come out on Friday – the US January inflation. In the absence of significant data the uptrend in the stock markets may persist. Note, that shares prices may depend on the Priceline.com and Wal-Mart retailers financial statements to be released on Wednesday and Thursday, respectively.
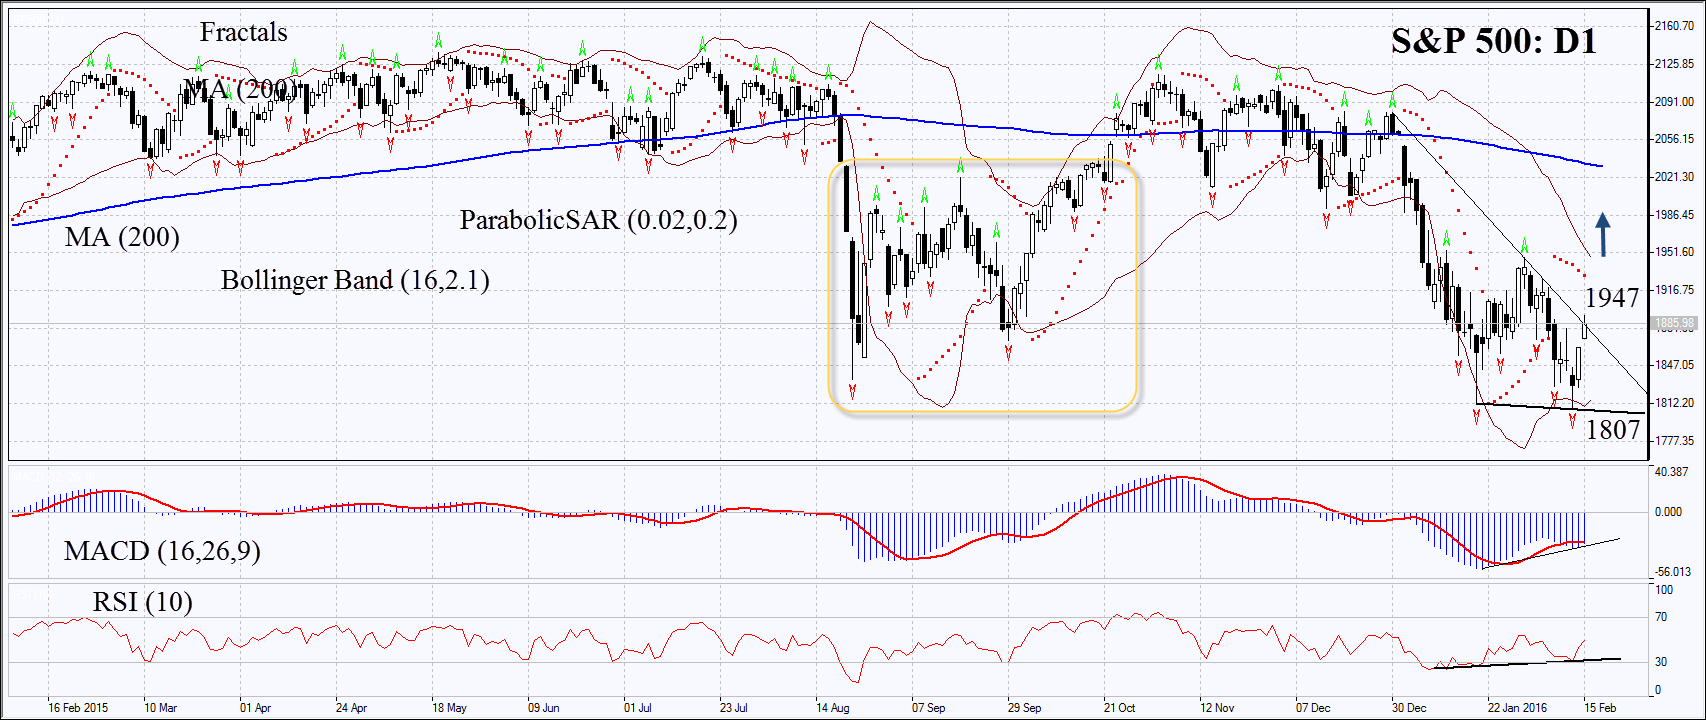
On the daily chart SP500: D1 is in downtrend and is struggling to break out of the triangle to head upwards. In such a case the double bottom chart pattern may be formed like in August-September last year. Now the MACD and Parabolic indicators still give sell signals. RSI is neutral and near 50. It has formed the positive divergence. The Bollinger bands have contracted which means lower volatility. The trend reversal and bullish momentum may take place in case S&P 500 surpasses the last fractal high, the Bollinger band and the Parabolic signal at 1947. This level may serve the point of entry. The initial risk-limit may be placed below the Parabolic signal and the last fractal low at 1807. Having opened the pending order we shall move the stop to the next fractal low following the Parabolic and Bollinger signals. Thus, we are changing the probable profit/loss ratio to the breakeven point. The most risk-averse traders may switch to the 4-hour chart after the trade and place there a stop-loss moving it in the direction of the trade. If the price meets the stop-loss level at 1807 without reaching the order at 1947, we recommend cancelling the position: the market sustains internal changes which were not taken into account.
| Position | Buy |
| Buy stop | above 1947 |
| Stop loss | below 1807 |
Explore our
Trading Conditions
- Spreads from 0.0 pip
- 30,000+ Trading Instruments
- Stop Out Level - Only 10%
Ready to Trade?
Open Account Note:
This overview has an informative and tutorial character and is published for free. All the data, included in the overview, are received from public sources, recognized as more or less reliable. Moreover, there is no guarantee that the indicated information is full and precise. Overviews are not updated. The whole information in each overview, including opinion, indicators, charts and anything else, is provided only for familiarization purposes and is not financial advice or а recommendation. The whole text and its any part, as well as the charts cannot be considered as an offer to make a deal with any asset. IFC Markets and its employees under any circumstances are not liable for any action taken by someone else during or after reading the overview.
