- Analytics
- Technical Analysis
SUGAR Technical Analysis - SUGAR Trading: 2018-08-29
Sugar harvest forecast was lowered in the EU
The drought continues in the EU countries. Will sugar prices rise?
The European crop monitoring service MARS has reduced the sugar beet harvest forecast to 73.8 tons per hectare from 77.9 tons per hectare because of the drought. The European Union ranks 3rd in the world sugar production after Brazil and India. The Unica association (Brazilian Sugarcane Industry Association) notes an increase in demand for bioethanol in Brazil, used as fuel, as oil prices increase. Biofuel is produced from sugarcane, which can reduce the supply of sugar. According to Unica, sugar production in central and southern Brazil in the first half of August 2018 decreased by 46% compared to the same period of 2017 and amounted to 1.715 million tons. Over the past 2 years, sugar prices have collapsed 2.3 times amid its world surplus forecasts. Earlier, the International Sugar Organization (ISO) estimated the surplus of sugar in the 2018/19 agricultural season at the level of 6.747 million tons.
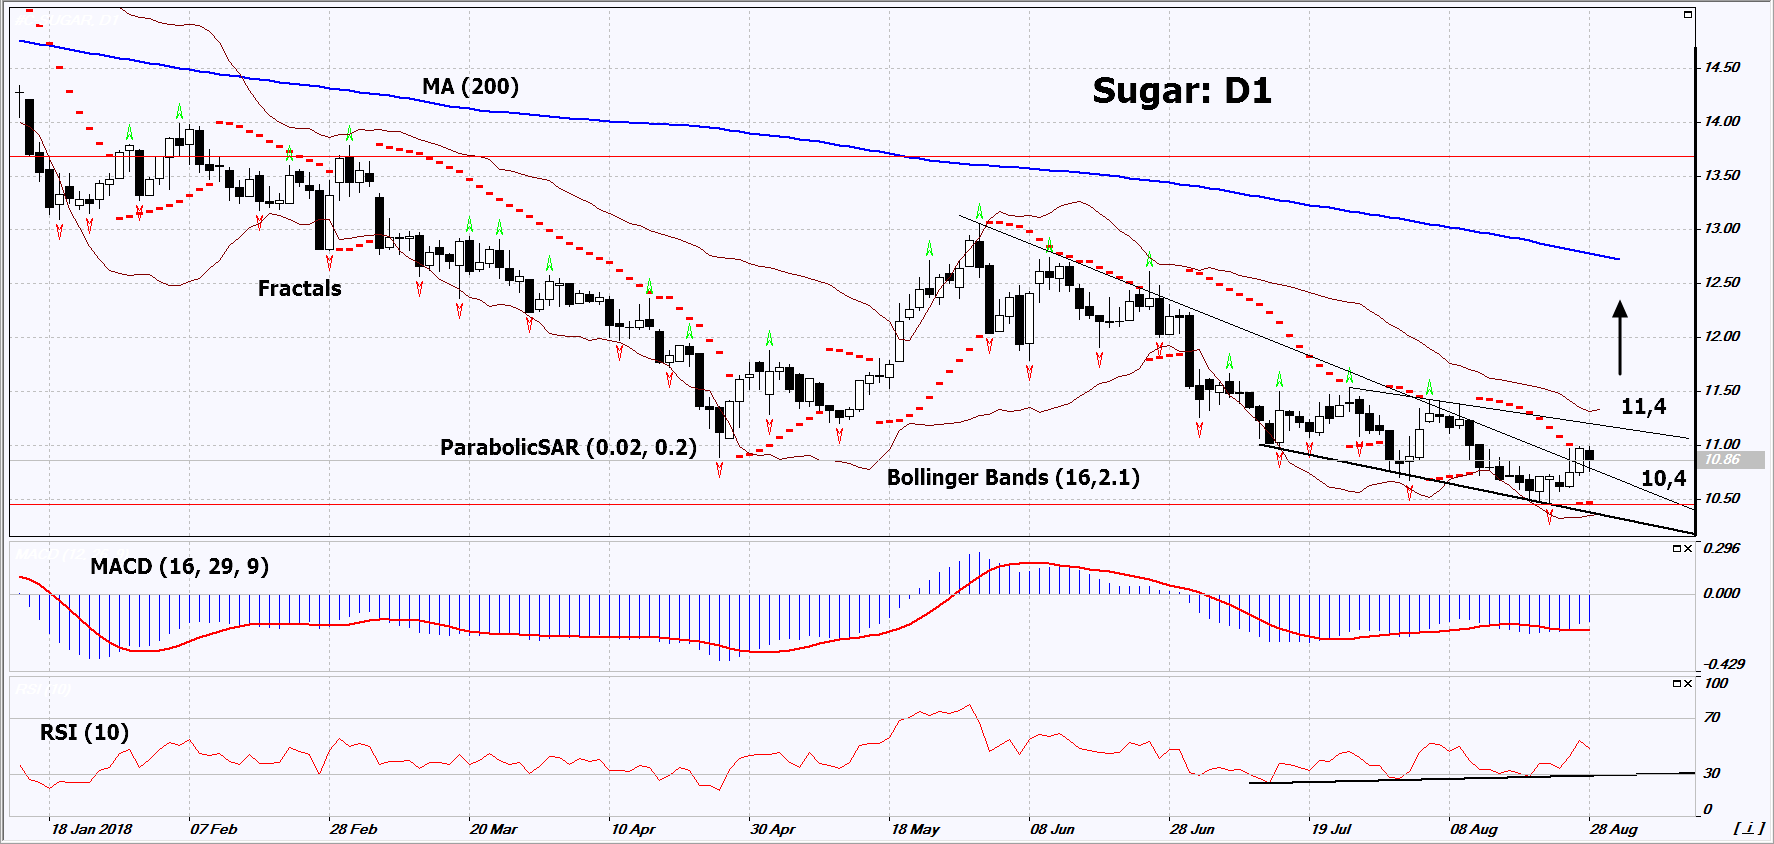
On the daily timeframe, Sugar: D1 breached up the resistance line of the downtrend and is trying to correct upward from the 10-year low. The further price increase is possible in case of a decrease in the world harvest.
- The Parabolic indicator gives a bullish signal.
- The Bollinger bands have narrowed, which indicates low volatility. They are titled upward.
- The RSI indicator is below 50. It has formed a positive divergence.
- The MACD indicator gives a bullish signal.
The bullish momentum may develop in case Sugar exceeds the last fractal high and the upper Bollinger band at 11.4. This level may serve as an entry point. The initial stop loss may be placed below the last fractal low, the Parabolic signal and the 10-year low at 10.4. After opening the pending order, we shall move the stop to the next fractal low following the Bollinger and Parabolic signals. Thus, we are changing the potential profit/loss to the breakeven point. More risk-averse traders may switch to the 4-hour chart after the trade and place there a stop loss moving it in the direction of the trade. If the price meets the stop level (10.4) without reaching the order (11.4), we recommend to close the position: the market sustains internal changes that were not taken into account.
Summary of technical analysis
| Position | Buy |
| Buy stop | Above 11,4 |
| Stop loss | Below 10,4 |
Explore our
Trading Conditions
- Spreads from 0.0 pip
- 30,000+ Trading Instruments
- Stop Out Level - Only 10%
Ready to Trade?
Open Account Note:
This overview has an informative and tutorial character and is published for free. All the data, included in the overview, are received from public sources, recognized as more or less reliable. Moreover, there is no guarantee that the indicated information is full and precise. Overviews are not updated. The whole information in each overview, including opinion, indicators, charts and anything else, is provided only for familiarization purposes and is not financial advice or а recommendation. The whole text and its any part, as well as the charts cannot be considered as an offer to make a deal with any asset. IFC Markets and its employees under any circumstances are not liable for any action taken by someone else during or after reading the overview.
