- Analytics
- Technical Analysis
USD/CNH Technical Analysis - USD/CNH Trading: 2018-02-13
Foreign Trade Surplus Decreased and Money Supply M2 Increased in China
The volume of China’s money supply M2 increased by 8.6% in January of this year compared to January 2017. This is much more than the preliminary forecasts. Will the USDCNH quotes advance?
Their increase indicates the weakening of the yuan against the US dollar. China seems to be increasing its money emission. The volume of new loans in RMB in January of this year updated a historic high and amounted to 2.9 trln yuan. This is much more than both the preliminary forecast of 2 trln and the December indicator of 584.4 bln yuan. The volume of money supply is advancing on the background of the expected slowdown in the rate of the Chinese economic growth to 6.5% in 2018, compared to the 6.9% growth in 2017. Another negative for the yuan may be the reduction in foreign trade surplus in January 2018 to the 11-month low of $20.34 bln. This is much worse than the forecast of $54.1 bln. In turn, the US dollar strengthening is supported by investors' expectations of a Fed rate hike next month. This week, no significant economic data are expected in China. From February 15 to 21, the country will celebrate the Chinese New Year.
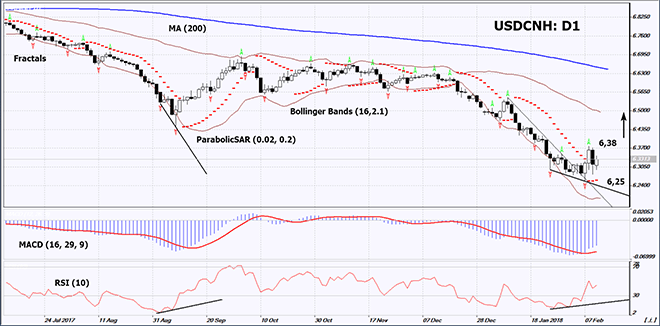
On the daily timeframe, USDCNH: D1 came out of the short-term downtrend and has been rising. The further price increase is possible in case of the publication of positive economic data in the US and negative ones in China.
- The Parabolic indicator gives a bullish signal.
- The Bollinger bands have widened, which means higher volatility.
- The RSI indicator is below 50. It has formed a positive divergence.
- The MACD indicator gives a bullish signal.
The bullish momentum may develop in case USDCNH exceeds the last fractal high at 6.38. This level may serve as an entry point. The initial stop loss may be placed below the last fractal low, the 2.5-year low and the Parabolic signal at 6.25. After opening the pending order, we shall move the stop to the next fractal low following the Bollinger and Parabolic signals. Thus, we are changing the potential profit/loss to the breakeven point. More risk-averse traders may switch to the 4-hour chart after the trade and place there a stop loss moving it in the direction of the trade. If the price meets the stop level at 6.25 without reaching the order at 6.38, we recommend cancelling the position: the market sustains internal changes that were not taken into account.
Summary of technical analysis
| Position | Buy |
| Buy stop | above 6,38 |
| Stop loss | below 6,25 |
Explore our
Trading Conditions
- Spreads from 0.0 pip
- 30,000+ Trading Instruments
- Stop Out Level - Only 10%
Ready to Trade?
Open Account Note:
This overview has an informative and tutorial character and is published for free. All the data, included in the overview, are received from public sources, recognized as more or less reliable. Moreover, there is no guarantee that the indicated information is full and precise. Overviews are not updated. The whole information in each overview, including opinion, indicators, charts and anything else, is provided only for familiarization purposes and is not financial advice or а recommendation. The whole text and its any part, as well as the charts cannot be considered as an offer to make a deal with any asset. IFC Markets and its employees under any circumstances are not liable for any action taken by someone else during or after reading the overview.
