- Analytics
- Technical Analysis
XAG/USD Technical Analysis - XAG/USD Trading: 2018-01-16
Silver falls behind in growth against gold
Precious metals are increasing in price on the background of the US dollar index decrease to the 3-year low. Will the silver quotes grow?
The US currency mostly weakens against euro. Investors expect a softening of the ECB monetary policy. Note that the range of the Fed rates is currently at 1.25-1.5% with the inflation of 2.1% in annual terms. The ECB rate is zero, but the Eurozone inflation is much lower than that of the US and amounts to 0.9%. The possible growth of the ECB rate increases the attractiveness of the euro against the US dollar. Additional negative factors for the US currency are political risks in the DPRK, Iran, etc. It should be noted that silver has increased by only 3.5% in the last 12 months. It markedly lags behind gold, which has advanced by 12% in the same period. Silver reserves in the largest private investment fund iShares Silver Trust are now at a 2-year low. Theoretically, investors' interest in it may increase on the background of the general rise in precious metals’ prices.
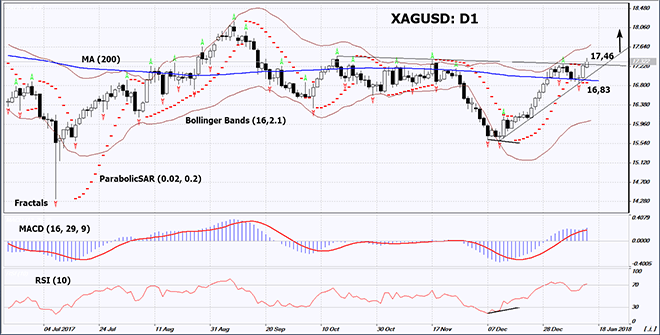
On the daily timeframe, XAGUSD: D1 is in the rising trend. During the latest correction it could not breach below the 200-day moving average line. It may become the support level for a fresh upward movement. The further price increase is possible in case of the worsening of the economic indicators in the US and the escalation of political risks.
- The Parabolic indicator gives a bullish signal.
- The Bollinger bands have widened, which means higher volatility. They are tilted upwards.
- The RSI indicator is above 50. No divergence.
- The MACD indicator gives a bullish signal.
The bullish momentum may develop in case XAGUSD exceeds the six last fractal highs at 17.46. This level may serve as an entry point. The initial stop loss may be placed below the 200-day moving average line, the Parabolic signal and the last fractal low at 16.83. After opening the pending order, we shall move the stop to the next fractal low following the Bollinger and Parabolic signals. Thus, we are changing the potential profit/loss to the breakeven point. More risk-averse traders may switch to the 4-hour chart after the trade and place there a stop loss moving it in the direction of the trade. If the price meets the stop level at 16.83 without reaching the order at 17.46, we recommend cancelling the position: the market sustains internal changes that were not taken into account.
Summary of technical analysis
| Position | Buy |
| Buy stop | above 17,46 |
| Stop loss | below 16,83 |
Explore our
Trading Conditions
- Spreads from 0.0 pip
- 30,000+ Trading Instruments
- Stop Out Level - Only 10%
Ready to Trade?
Open Account Note:
This overview has an informative and tutorial character and is published for free. All the data, included in the overview, are received from public sources, recognized as more or less reliable. Moreover, there is no guarantee that the indicated information is full and precise. Overviews are not updated. The whole information in each overview, including opinion, indicators, charts and anything else, is provided only for familiarization purposes and is not financial advice or а recommendation. The whole text and its any part, as well as the charts cannot be considered as an offer to make a deal with any asset. IFC Markets and its employees under any circumstances are not liable for any action taken by someone else during or after reading the overview.
