fbUS Dollar Index Steady Below 80.59, Wary on US Monetary Path and Debt Ceiling | IFCM UK
Logo IFCMarkets
NetTradeX for IFC Markets
Trading App
IFC Markets Online CFD Broker

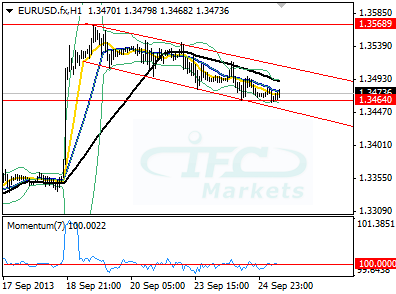
US Dollar Index Steady Below 80.59, Wary on US Monetary Path and Debt Ceiling - 25.9.2013

FX currency pairs are mainly moving on news events and central banks releases with the rest of the time doing sideways. Like yesterday when the US dollar rose slightly to resistance at 80.59 on positive Housing sector data and then continuing its range trading below that resistance.


Market participants are uncertain whether the Fed would taper its monthly asset purchases in October meeting after mixed messages from FOMC members, which lead investors to seek safer currencies like the Japanese Yen. In addition, concerns are increasing regarding US debt ceiling as the US policymakers would need to approve a higher debt limit than the current of $16.7B by mid-October. US economy runs the risk of credit-rating downgrade as the Congress delays decision on raising borrowing limit. US equities reflected that risk by closing lower with S&P 500 falling by 0.26% and Dow Jones Industrial Average losing by 0.43%.


Furthermore, NIKKEI 225 was also under selling pressure due to investors being wary over US Government funding and direction of Fed monetary path. The Japanese major index dipped by 0.76% adding selling pressure on the USDJPY that is heading back towards 61.8% of 97.76 to 99.66, at 98.48.


Therefore we have a situation where risk appetite is mildly squeezed, the US dollar in range, USDJPY potentially could go lower, AUDUSD falling and has just breached support at 0.9366. Thus we would consider the AUDJPY could weaken further should the USDJPY also breach its key support at 98.48. At the time being the cross currency pair is down trending suggesting in technical terms is bearish.


AUDJPY
US Dollar Index Steady Below 80.59, Wary on US Monetary Path and Debt Ceiling


Elsewhere, the common currency remains under pressure against the greenback, gradually falling to 1.3464 and remaining in descending flag formation, which technically means that it remains in a bullish pattern.


Euro VS US dollar
US Dollar Index Steady Below 80.59, Wary on US Monetary Path and Debt Ceiling


Looking ahead, market participants are focusing on US Durable Goods orders and US New Home Sales, both are expected to improve compared to previous reading.

News

30-year Treasury yield has crossed 5%

30-year Treasury yield has crossed 5%

The 30-year Treasury yield has crossed 5% , let’s see who pays the price 5% 30Y yield breached $39T National debt $1.2T...

13/5/2026
Oil Price Analysis 2026 May

Oil Price Analysis 2026 May

WTI crude futures fell below the $93 per barrel mark this morning, marking a sharp extension of yesterday’s sell-off. Market...

7/5/2026
Why Oil Prices Could Crash to $60

Why Oil Prices Could Crash to $60

Kevin Warsh is the frontrunner to lead the Federal Reserve, and he wants to change how the bank for banks operates. For the...

30/4/2026
Nike Stock Price: What Happened and Why

Nike Stock Price: What Happened and Why

So, Nike just dropped its fiscal Q3 numbers on March 31st, and on paper, they actually looked pretty solid. They pulled in...

10/4/2026
META Lost $119 Billion in a Day

META Lost $119 Billion in a Day

Structural bearish pressure is building up; two verdicts confirm the product defect legal theory and now we have a replicable...

3/4/2026
Bitcoin at $67K: Key Levels, Technicals and What's Driving the Price

Bitcoin at $67K: Key Levels, Technicals and What's Driving the Price

Bitcoin is in a later stage of post-halving cycle, meaning prices peak and start pulling back. Big institutional buyers are...

31/3/2026

Explore our
Trading Conditions

  • Spreads from 0.0 pip
  • 30,000+ Trading Instruments
  • Stop Out Level - Only 10%

Ready to Trade?

See Also