

- Education
- Forex Technical Analysis
- Chart Patterns
- Reversal Patterns
- Double Bottom
Double Bottom Pattern
Spotting a reversal before the crowd can turn a losing streak into a winning trade. The Double Bottom is one of the most reliable bullish reversal signals in technical analysis, and this guide breaks down how to identify it, trade it, and set realistic price targets.
DEFINITION:
The double bottom price pattern is believed to be a sign of existing downtrend reversal. Prices are expected to begin a rally following its formation, while the longer it takes for the pattern to be formed the more reliable it is.
Key Moments
- A Double Bottom forms when price tests the same support level twice, signaling that sellers are losing control.
- The pattern is a bullish reversal signal that typically appears after a sustained downtrend in the market.
- Confirmation occurs when price breaks and closes above the neckline resistance connecting the two peaks between the bottoms.
- Trading volume usually rises on the breakout, adding confidence that buyers have taken control of price direction.
- Measuring the pattern's height and projecting it from the breakout point gives traders a realistic profit target.
What is a Double Bottom in Trading
A Double Bottom is a bullish reversal pattern that forms when price falls to a support level, bounces, and tests that same level a second time. The pattern resembles the letter "W" on a price chart, with two distinct lows separated by a moderate peak in between. It typically appears at the end of a prolonged downtrend, signaling that selling pressure is beginning to fade.
Traders watch this formation closely because it reflects a clear shift in market psychology from bearish to bullish. The first low often triggers panic selling, while the second low fails to push price meaningfully lower, showing exhausted momentum. This failure to make a new low is what separates a genuine Double Bottom from a simple retest of support.
The pattern gains significance once price rallies past the peak between the two lows, known as the neckline. This breakout confirms that buyers have overwhelmed sellers and that a new uptrend may be underway. Many traders combine this signal with volume and momentum indicators to filter out false breakouts.
Is Double Bottom Bullish or Bearish
The Double Bottom is a bullish pattern, signaling a likely reversal from a downtrend into an emerging uptrend. It forms only after a sustained decline, which distinguishes it structurally from bearish continuation or reversal formations. Once confirmed, it suggests that the prevailing bearish sentiment has run its course.
Its bullish nature stems from the repeated rejection of lower prices at the same support zone. Each test of support that fails to break lower reinforces the idea that demand is stepping in at that price. This repeated defense of a key level is a hallmark of accumulating buying interest.
Confirmation strengthens the bullish case considerably, since a neckline breakout with rising volume shows real conviction behind the move. Without that breakout, the pattern remains only a potential setup rather than a confirmed signal. Traders generally wait for this confirmation before treating the pattern as a reliable buy signal.
How to Trade Double Bottom Pattern
Trading a Double Bottom effectively requires patience through the formation phase and discipline at the breakout. Below is a step-by-step approach traders commonly follow when using this pattern, from spotting the setup to managing the trade after entry.
1. Identify the Downtrend and First Low
Look for a clear downtrend followed by a sharp low where selling pressure appears to stall. This first low sets the reference point for the support level the pattern will test again.
2. Watch for the Neckline Formation
After the bounce from the first low, price should rally to form a peak, which becomes the neckline. This intermediate high is the resistance level price must later break to confirm the pattern.
3. Confirm the Second Low
Watch for price to decline again and test the same support zone without breaking meaningfully below it. A shallower or equal second low strengthens the case that sellers are losing momentum.
4. Wait for the Neckline Breakout
Enter the trade once price closes decisively above the neckline, ideally on increased trading volume. Acting before this confirmation increases the risk of getting caught in a false signal.
5. Set a Stop Loss and Price Target
Place a stop loss just below the second low to protect against a failed breakout. Measure the pattern's height and project it upward from the breakout point to estimate a realistic target.
6. Practice and Execute on a Trading Platform
Before risking real capital, practice spotting and trading this pattern using a demo environment. When ready, you can open trading account and execute your strategy on platforms such as MetaTrader 4, MetaTrader 5, or NetTradeX.
How to Identify Double Bottom Pattern
Identifying a genuine Double Bottom starts with confirming that price has been in a clear downtrend before the pattern begins. Without a preceding decline, a "W" shape on the chart is more likely noise than a true reversal signal. Context matters as much as the shape itself when validating the setup.
The two lows should occur at approximately the same price level, though minor variation is normal and acceptable. A significant difference between the two lows can weaken the pattern's reliability and suggest a different structure is forming instead. Traders often allow a small tolerance range rather than demanding an exact match.
Volume behavior offers another useful clue, since it often declines on the second low and expands sharply on the breakout. This pattern of volume reflects fading selling pressure followed by a surge of buying interest. Combining price structure with volume analysis helps traders avoid mistaking random dips for a true reversal.
The price dynamics under the pattern is similar to the Latin letter “w”. The two most recent lows of the price represent a strong support area where investors reversed their short positions thinking the asset is underpriced at this level. On the other hand the most recent local high is considered to be a resistance level.
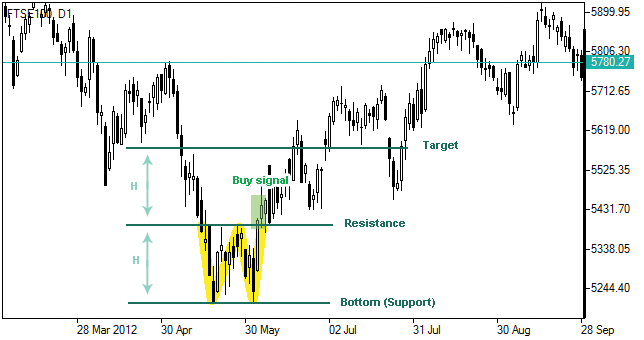
When the market price breaks above the pattern’s maximum or resistance level (plus certain deviation is possible), the formation is considered to be completed and can be interpreted as change in direction of the trend upwards serving as a buy signal.
Following double bottom pattern formation the price is generally believed to rise at least to its target level, calculated as follows:
T = R + H, Where:T – target level;
R – resistance level (recent local high);
H – pattern’s height (distance between support and resistance levels).
Conclusion
The Double Bottom remains one of the most dependable bullish reversal patterns available to forex and CFD traders today. Its clear structure, defined by two tested lows and a confirming neckline breakout, makes it accessible even to beginners. Pairing the pattern with volume confirmation and sound risk management improves the odds of a successful trade.
Like any technical pattern, it works best as part of a broader strategy rather than in isolation. Combining it with trend analysis, support and resistance levels, or momentum indicators can filter out weaker setups. Traders who practice recognizing this pattern consistently often find it a valuable addition to their trading toolkit.
Forex Indicators FAQ
What is a Forex Indicator?
Forex technical analysis indicators are regularly used by traders to predict price movements in the Foreign Exchange market and thus increase the likelihood of making money in the Forex market. Forex indicators actually take into account the price and volume of a particular trading instrument for further market forecasting.
What are the Best Technical Indicators?
Technical analysis, which is often included in various trading strategies, cannot be considered separately from technical indicators. Some indicators are rarely used, while others are almost irreplaceable for many traders. We highlighted 5 the most popular technical analysis indicators: Moving average (MA), Exponential moving average (EMA), Stochastic oscillator, Bollinger bands, Moving average convergence divergence (MACD).
How to Use Technical Indicators?
Trading strategies usually require multiple technical analysis indicators to increase forecast accuracy. Lagging technical indicators show past trends, while leading indicators predict upcoming moves. When selecting trading indicators, also consider different types of charting tools, such as volume, momentum, volatility and trend indicators.
Do Indicators Work in Forex?
There are 2 types of indicators: lagging and leading. Lagging indicators base on past movements and market reversals, and are more effective when markets are trending strongly. Leading indicators try to predict the price moves and reversals in the future, they are used commonly in range trading, and since they produce many false signals, they are not suitable for trend trading.

Not sure about your Forex skills level?
Take a Test and We Will Help You With The Rest
You can see the graphical object on the price chart by downloading one of the trading terminals offered by IFC Markets.



Was this article helpful?

 You can study CFD trading more thoroughly and see CFD trading examples in the section How To Trade CFDs Visit Educational Center