

- Education
- Forex Technical Analysis
- Chart Patterns
- Continuation Patterns
- Bullish Rectangle
Rectangle Pattern (Bullish): Forex Chart Pattern
Spotting a pause in a strong uptrend can be confusing for new traders, but the bullish rectangle pattern helps make sense of it. This continuation pattern signals that buyers are simply catching their breath before pushing price higher. Below, we cover its key moments and exactly how it forms.
DEFINITION:
The rectangle graphical price pattern serves for existing trend confirmation. The bullish version is usually formed in an uptrend and signals the trend’s direction will prevail after its occurrence on the chart.
Key Moments
- A bullish rectangle typically forms during an uptrend as price consolidates between two parallel support and resistance lines before continuing higher.
- Trading volume often contracts inside the rectangle and then expands sharply once price breaks above resistance, confirming genuine buying interest.
- Traders commonly measure the rectangle's height and project that distance upward from the breakout point to estimate a realistic price target.
- False breakouts can occur, so many traders wait for a decisive close above resistance before entering a long position.
- The pattern can appear across multiple timeframes and asset classes, including forex pairs, stocks, indices, and commodities.
Bullish Rectangle Pattern Formation
A bullish rectangle forms when buyers and sellers reach a temporary balance after a strong upward price move. Price oscillates between a clearly defined support level below and a resistance level above, creating a horizontal trading range. This pause allows the market to digest recent gains before determining whether the prevailing uptrend has enough strength to continue.
During formation, price tests resistance several times without breaking through, while support consistently holds each time sellers push price lower. Each touch of these boundaries strengthens the pattern's validity, since more tests generally indicate a more reliable and tradable structure. Volume typically declines as the rectangle develops, reflecting reduced conviction among traders while the market awaits a clearer directional signal.
The pattern completes when price finally breaks decisively above resistance, ideally accompanied by a noticeable increase in trading volume. This breakout signals that buyers have regained control and that the earlier uptrend is likely to resume its upward trajectory. Traders then watch for a retest of the broken resistance level, which often turns into new support before price continues climbing.
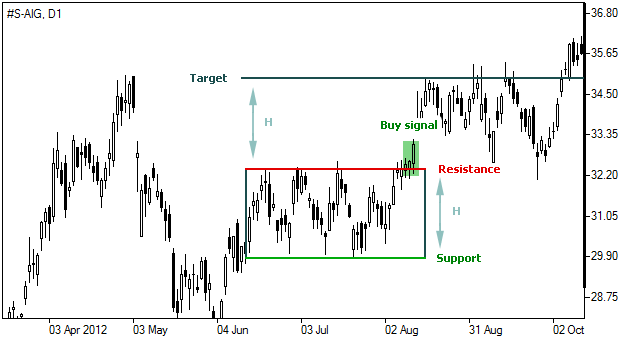

Interpretation of Bullish Rectangle
The price climbing above the resistance line (plus certain deviation is possible) is considered a buy signal as the level at which the asset has been repeatedly sold is finally overcome.
Target price
Following a bullish rectangle pattern formation the price is generally believed to rise at least to its target level, calculated as follows:
T = R + H, Where:T – target price;
R – resistance level (pattern’s top);
H – pattern’s height (distance between support and resistance).
Forex Indicators FAQ
What is a Forex Indicator?
Forex technical analysis indicators are regularly used by traders to predict price movements in the Foreign Exchange market and thus increase the likelihood of making money in the Forex market. Forex indicators actually take into account the price and volume of a particular trading instrument for further market forecasting.
What are the Best Technical Indicators?
Technical analysis, which is often included in various trading strategies, cannot be considered separately from technical indicators. Some indicators are rarely used, while others are almost irreplaceable for many traders. We highlighted 5 the most popular technical analysis indicators: Moving average (MA), Exponential moving average (EMA), Stochastic oscillator, Bollinger bands, Moving average convergence divergence (MACD).
How to Use Technical Indicators?
Trading strategies usually require multiple technical analysis indicators to increase forecast accuracy. Lagging technical indicators show past trends, while leading indicators predict upcoming moves. When selecting trading indicators, also consider different types of charting tools, such as volume, momentum, volatility and trend indicators.
Do Indicators Work in Forex?
There are 2 types of indicators: lagging and leading. Lagging indicators base on past movements and market reversals, and are more effective when markets are trending strongly. Leading indicators try to predict the price moves and reversals in the future, they are used commonly in range trading, and since they produce many false signals, they are not suitable for trend trading.

Not sure about your Forex skills level?
Take a Test and We Will Help You With The Rest
You can see the graphical object on the price chart by downloading one of the trading terminals offered by IFC Markets.



Was this article helpful?

 You can study CFD trading more thoroughly and see CFD trading examples in the section How To Trade CFDs Visit Educational Center