- Education
- Forex Technical Analysis
- Chart Patterns
- Continuation Patterns
- Ascending Triangle Pattern
Ascending Triangle: Ascending Pattern in Trading
DEFINITION:
The Ascending triangle is a trend continuation pattern typically formed in an uptrend that serves for existing direction confirmation.
What is Ascending Triangle Pattern
An ascending triangle pattern is a trend continuation formation that typically appears during an uptrend, signaling that the prevailing bullish momentum is likely to persist. It forms when price action gets compressed between two converging trendlines: a flat resistance line connecting a series of highs at roughly the same level, and a rising support line connecting a series of progressively higher lows.
This combination creates the triangle's characteristic shape, with a horizontal "ceiling" on top and an ascending "floor" pushing up from below.
The pattern's significance lies in what this price behavior reveals about market psychology. Each time price approaches resistance and pulls back, sellers are stepping in at the same level, capping upward moves.
But each pullback finds support at a higher point than the last, meaning buyers are becoming more willing to commit at increasingly elevated prices. This steady absorption of selling pressure suggests that demand is gradually overpowering supply.
As the triangle narrows, the standoff between buyers and sellers intensifies, and the eventual breakout — usually through resistance — often confirms that the existing uptrend has enough strength to continue.
Ascending Triangle Formation
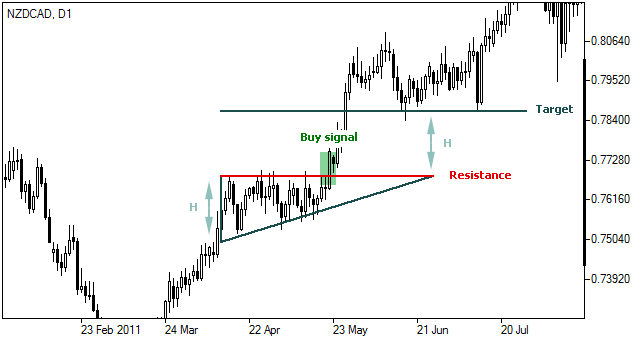
This pattern is represented by a narrowing price range between high and low prices, visually forming a triangle. The main distinctive feature of this type of triangles is that it generally has a horizontal trendline (resistance) connecting the highs at roughly the same level and an ascending trendline (support) connecting higher and higher lows.
How to Trade Ascending Triangle Pattern
Once you've spotted the pattern, trading it comes down to a clear sequence: confirm the structure, wait for confirmation, choose an entry point, and manage the trade with a defined target and stop-loss.
1. Identify the Pattern
Look for a horizontal resistance line connecting the highs and a rising support line connecting the lows. Confirm at least two or three touches on each line before treating the pattern as valid.
2. Wait for the Breakout
Watch for a decisive break above resistance, usually occurring between the halfway and three-quarters point of the pattern. Look for rising volume to confirm the move isn't a false breakout.
3. Choose Your Entry
Enter long on the breakout for an earlier position, or wait for a retest of the broken resistance (now support) for a tighter, lower-risk entry.
4. Set Your Price Target
Measure the triangle's height at its widest point. Add this value to the resistance level: target price = resistance + height.
5. Manage Risk
Place a stop-loss just below the most recent swing low or back inside the triangle. Pair the pattern with volume or momentum indicators to filter out weaker setups.
Interpretation of Ascending Triangle
When the price breaks above the resistance line (plus certain deviation is possible), usually somewhere between halfway and three-quarters of the way through the pattern, a buy signal is received.
Ascending Triangle Target Price
Following an ascending triangle pattern formation the price is generally believed to rise at least to its target level, calculated as follows:
T = R + H, Where:T – target price;
R – resistance (horizontal line);
H – pattern’s height (distance between support and resistance lines at pattern’s origin).
You can see the graphical object on the price chart by downloading one of the trading terminals offered by IFC Markets.