- Analytics
- Technical Analysis
Brent Oil Technical Analysis - Brent Oil Trading: 2017-05-05
Weak demand a headwind for Brent crude price
Brent crude price has been declining on continued excess of supply over global demand. Will the price continue falling?
The US Energy Information Agency reported on Wednesday the decline in US inventories was much less than expected. US crude inventories fell by 930 thousand barrels last week, the fourth consecutive decline, but at 527.8 million barrels they are still 3% higher from this time a year ago. At the same time gasoline stockpiles edged up by 200 thousand barrels, as gasoline demand continues to remain weak pointing to another inventories build. Weak US gasoline demand is bearish for oil prices with global market struggling to rebalance the supply glut.
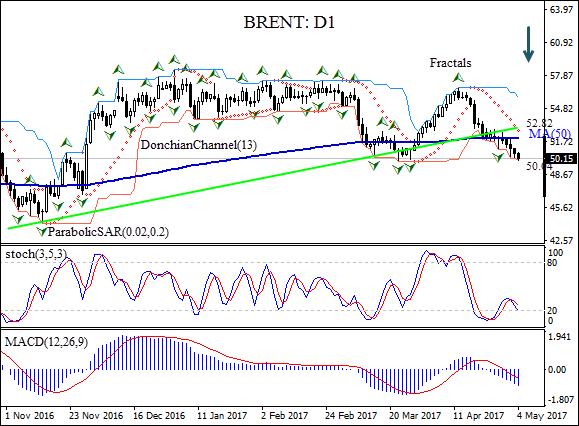
On the daily chart the BRENT: D1 has been retracing after rebounding to two month high in mid-April. The price has fallen below the 200-day moving average MA(200).
- The Parabolic indicator gives a sell signal.
- The Donchian channel indicates a downtrend: it is tilted downward.
- The stochastic oscillator is falling but hasn’t reached the oversold zone yet.
- The MACD indicator is below the signal line and the gap is rising which is also a bearish signal.
We expect the bearish momentum will continue after the price breaches below lower Donchian bound at 50.04. This level can be used as an entry point for a pending order to sell. The stop loss can be placed above the Parabolic signal at 52.82. After placing the pending order, the stop loss is to be moved to the next fractal low, following Parabolic signals. By doing so, we are changing the probable profit/loss ratio to the breakeven point. The most risk-averse traders may switch to the 4-hour chart after the trade and place there a stop-loss moving it in the direction of the trade. If the price meets the stop loss level (52.82) without reaching the order (50.04), we recommend canceling the position: the market sustains internal changes which were not taken into account.
Technical Analysis Summary
| Position | Sell |
| Sell stop | Below 50.04 |
| Stop loss | Above 52.82 |
Explore our
Trading Conditions
- Spreads from 0.0 pip
- 30,000+ Trading Instruments
- Stop Out Level - Only 10%
Ready to Trade?
Open Account Note:
This overview has an informative and tutorial character and is published for free. All the data, included in the overview, are received from public sources, recognized as more or less reliable. Moreover, there is no guarantee that the indicated information is full and precise. Overviews are not updated. The whole information in each overview, including opinion, indicators, charts and anything else, is provided only for familiarization purposes and is not financial advice or а recommendation. The whole text and its any part, as well as the charts cannot be considered as an offer to make a deal with any asset. IFC Markets and its employees under any circumstances are not liable for any action taken by someone else during or after reading the overview.
