- Analytics
- Technical Analysis
GBP/USD Technical Analysis - GBP/USD Trading: 2016-04-26
US President Barack Obama visited Great Britain
US President Barack Obama paid a visit to Great Britain and warned it against Brexit. After that, according to Betfair agency, the chances for Brexit fell from 37% early last week to 25%. The referendum on the matter is to take place on June 23. The British pound lost against the US dollar around 10% since last November when the referendum was first discussed. Will the GBPUSD pair continue advancing? On Monday the pound hit a fresh 10-week high.
The majority of investors believe the ongoing current account deficit of 7% makes the British economy very dependent on foreign capital inflow and the Brexit may hurt the capital flows which may have most negative consequences. In the course of his visit Barack Obama warned the UK that the Brexit will postpone the new trade agreement with the US and will deprive Britain of trade preferences. Most market participants believe this is a strong reason for maintenance of EU membership. The US are planning to conclude a Transatlantic Trade and Investment Partnership with EU. Barack Obama said if Great Britain is to leave EU, it will be the last to discuss the trade agreements with. Previously, the proponents of Brexit claimed the Brexit has nothing to do with UK-US relations so the visit of US President played a significant role. The economic data look weak in Great Britain. Last week the March retail sales dipped. This Wednesday the Q1 GDP data will be released, it is expected to edge slightly lower compared to last year and last quarter. The real reading may affect the sterling rate.
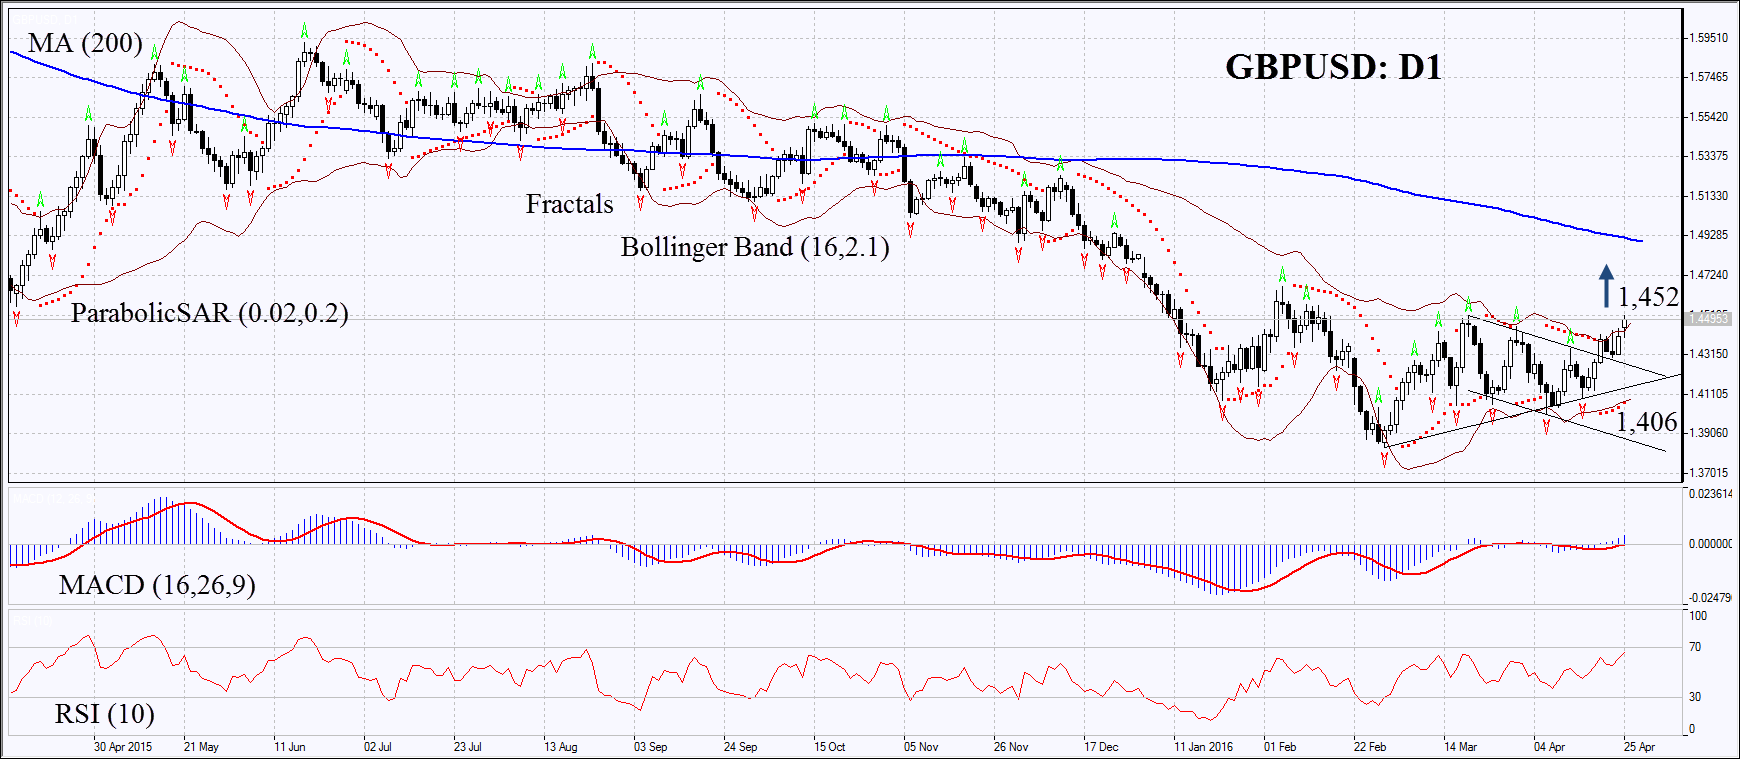
On the daily chart GBPUSD: D1 has left the downtrend to move upwards. The MACD and Parabolic indicators have formed the bullish signals. RSI has come close to the overbought zone but has not approached it yet. No divergence. The Bollinger bands have contracted which means lower volatility. Some of the recent candles closed above the upper Bollinger band. The bullish momentum may develop in case the British pound surpasses the third upper fractal at 1.452. This level may serve the point of entry. The initial risk-limit may be placed below the Parabolic signal and the support of the uptrend at 1.406. Having opened the pending order we shall move the stop to the next fractal low following the Parabolic and Bollinger signals. Thus, we are changing the probable profit/loss ratio to the breakeven point. The most risk-averse traders may switch to the 4-hour chart after the trade and place there a stop-loss moving it in the direction of the trade. If the price meets the stop-loss level at 1.406 without reaching the order at 1.452, we recommend cancelling the position: the market sustains internal changes which were not taken into account.
| Position | Buy |
| Buy stop | above 1.452 |
| Stop loss | below 1.406 |
Explore our
Trading Conditions
- Spreads from 0.0 pip
- 30,000+ Trading Instruments
- Stop Out Level - Only 10%
Ready to Trade?
Open Account Note:
This overview has an informative and tutorial character and is published for free. All the data, included in the overview, are received from public sources, recognized as more or less reliable. Moreover, there is no guarantee that the indicated information is full and precise. Overviews are not updated. The whole information in each overview, including opinion, indicators, charts and anything else, is provided only for familiarization purposes and is not financial advice or а recommendation. The whole text and its any part, as well as the charts cannot be considered as an offer to make a deal with any asset. IFC Markets and its employees under any circumstances are not liable for any action taken by someone else during or after reading the overview.
