- Analytics
- Technical Analysis
USD/JPY Technical Analysis - USD/JPY Trading: 2015-02-10
Trend continues
Let us analyze the USD/JPY pair on the H4 chart. This morning Japan announced several minor economic indicators. They appeared to be negative. Q4 Housing Loans and Tertiary Industry Index for December turned out to be worse-than-expected. To be noted, Industrial Production for December will be released on Wednesday at 23:50 CET in Japan. The tentative outlook is positive for yen, resulting in USD/JPY currency pair downward movement. It is to be considered when trading, as well as the fact that no important Japanese macroeconomic data are expected this week. Today at 15:00 CET Wholesale Inventories will be issued in the USA. The forecast is neutral. Market may react, if real figures deviate widely from estimated ones.
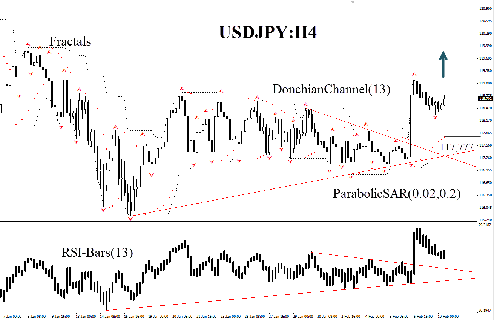
On the H4 time frame the USD/JPY steadily moved far above the triangle. Then it showed a slight pullback and formed a “flag” pattern. As a rule, it implies the current trend, which is the uptrend now, to continue. The RSI-Bars oscillator shaped a combination of similar figures, which confirms the trend in our judgment. The RSI latest bars didn’t go below 50. This is a good “bullish” sign, supposing yen to weaken further. To be kept in mind, Industrial Production may affect the trend, if data appear to be too positive. Probably, conservative traders had better wait for the data release. Yet, we don't rule out further “bullish” momentum after the fractal resistance is breached at 119.216: you may place a buy pending order there. Stop loss may be placed at 117.777, indicated most recently by Parabolic. This mark can be considered as a support line at the moment. After pending order activation, Stop loss is to be moved every four hours near the next fractal low, following Parabolic signals. Thus, we are changing the probable profit/loss ratio to the breakeven point. If the price meets Stop loss level without reaching the order, we recommend canceling the position: market sustains internal changes that were not considered.
| Position | Buy |
| Buy stop | above 119,216 |
| Stop loss | below 117,777 |
Explore our
Trading Conditions
- Spreads from 0.0 pip
- 30,000+ Trading Instruments
- Stop Out Level - Only 10%
Ready to Trade?
Open Account Note:
This overview has an informative and tutorial character and is published for free. All the data, included in the overview, are received from public sources, recognized as more or less reliable. Moreover, there is no guarantee that the indicated information is full and precise. Overviews are not updated. The whole information in each overview, including opinion, indicators, charts and anything else, is provided only for familiarization purposes and is not financial advice or а recommendation. The whole text and its any part, as well as the charts cannot be considered as an offer to make a deal with any asset. IFC Markets and its employees under any circumstances are not liable for any action taken by someone else during or after reading the overview.
