- Analytics
- Technical Analysis
XAU/USD Technical Analysis - XAU/USD Trading: 2016-03-15
Getting ready to Central Banks meetings
Gold started falling in price from its 13-month high hit on March 11 this year ahead of the ECB meeting. Investors believe the precious metal may lose its relish in case the additional monetary stimulus from ECB supports the European and global economic expansion. This week the US Fed and Central Banks of England, Japan, Australia, Switzerland and Norway meetings are due this week. Some of them may follow the ECB steps and take measures to support national economies. Will the downtrend in gold continue?
Since the start of the current year the gold has already advanced around 18%. Its net longs reached the highest since February 2015 on COMEX exchange, according to U.S. Commodity Futures Trading Commission covering data in the week to March 8. Now the gold prices are edging lower amid the slight strengthening of the US dollar index. As a rule, the gold and the US currency are negatively correlated. The Fed meeting and the press-conference with Janet Yellen are due on Wednesday. If the US regulator is to hike the rates this year, the news may have negative effect on gold. Last week the China’s demand for physical gold decreased amid its price increase while in India the goldsmiths went on strike against the additional tax on golden jewellery.
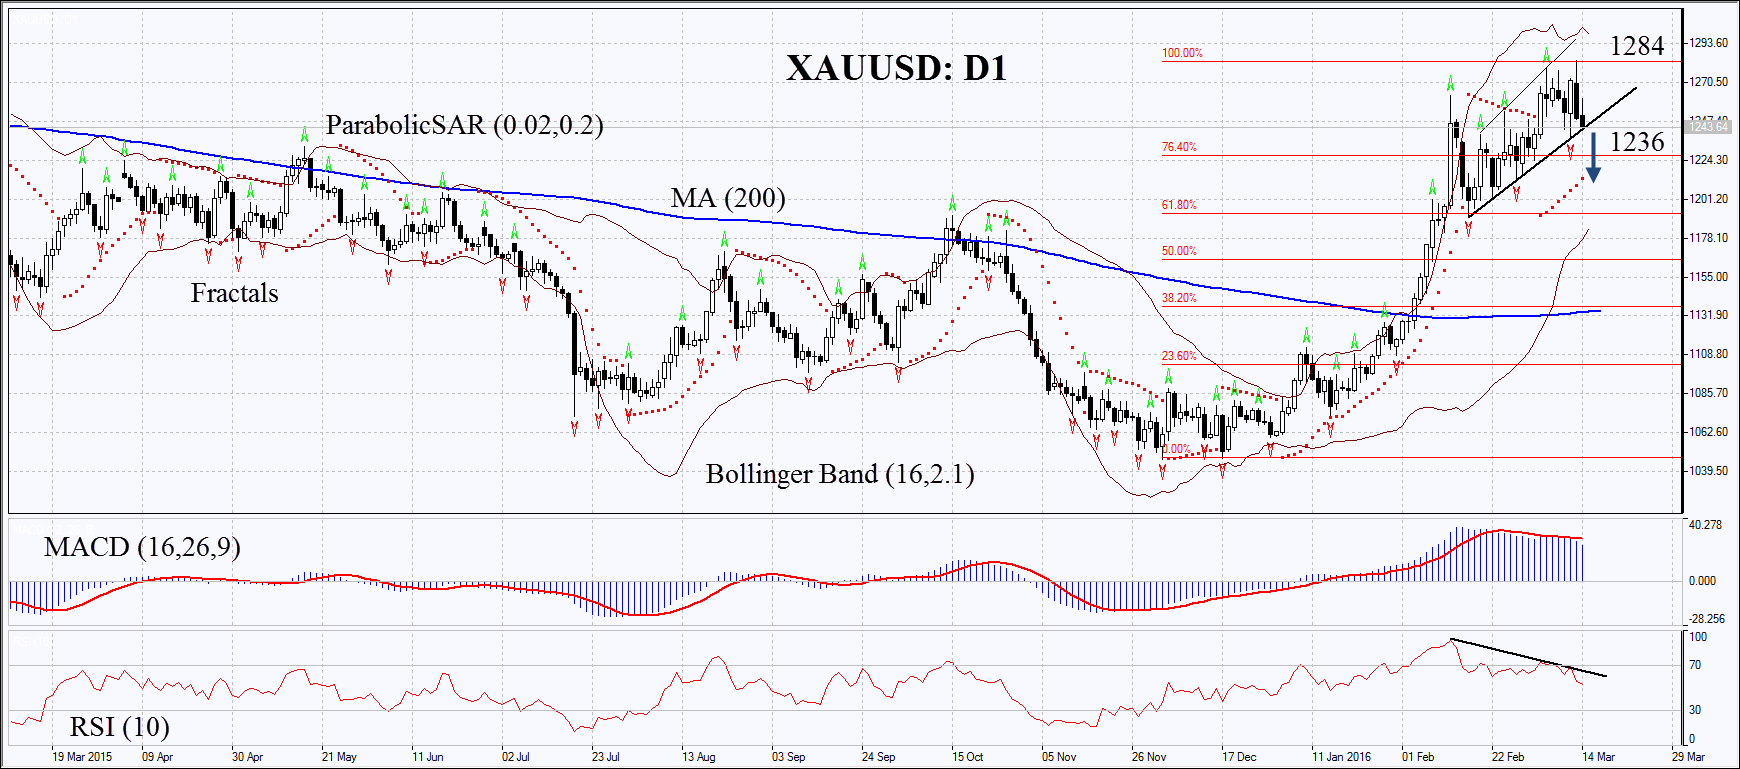
On the daily chart XAUUSD: D1 is correcting down from its 13-month high. The MACD has formed the signal to sell while Parabolic has not reversed yet. The RSI has fallen to the level of 50 and has formed the negative divergence. The Bollinger bands have widened a lot which means higher volatility. The bearish momentum may develop in case the gold price falls below the last fractal low support line at 1236. This level may serve the point of entry. The initial risk-limit may be placed above the last fractal high and the 13-month high at 1284. Having opened the pending order we shall move the stop to the next fractal low following the Parabolic and Bollinger signals. Thus, we are changing the probable profit/loss ratio to the breakeven point. The most risk-averse traders may switch to the 4-hour chart after the trade and place there a stop-loss moving it in the direction of the trade. If the price meets the stop-loss level at 1284 without reaching the order at 1236, we recommend cancelling the position: the market sustains internal changes which were not taken into account.
| Position | Sell |
| Sell stop | below 1236 |
| Stop loss | above 1284 |
Explore our
Trading Conditions
- Spreads from 0.0 pip
- 30,000+ Trading Instruments
- Stop Out Level - Only 10%
Ready to Trade?
Open Account Note:
This overview has an informative and tutorial character and is published for free. All the data, included in the overview, are received from public sources, recognized as more or less reliable. Moreover, there is no guarantee that the indicated information is full and precise. Overviews are not updated. The whole information in each overview, including opinion, indicators, charts and anything else, is provided only for familiarization purposes and is not financial advice or а recommendation. The whole text and its any part, as well as the charts cannot be considered as an offer to make a deal with any asset. IFC Markets and its employees under any circumstances are not liable for any action taken by someone else during or after reading the overview.
