- Analytics
- Technical Analysis
Allianz SE Technical Analysis - Allianz SE Trading: 2016-01-05
Indemnification for storm losses may cut incomes
The GDV group forecasts the amount of claims against the German insurers may rise to 2.2bn euros amid the natural disasters in 2015. The sum is far above the 1.6bn euros a year earlier. Will the major German insurer Allianz SE see its stocks falling?
The Niklas storm alone raging in Germany in March 2015 brought indemnification claims for 750mln euros. Currently the Frank storm is raging in Ireland and Great Britain being already the 6th named storm in 2 months. The insurer Allianz has published a number of advices of flood and strong wind protection for those in the storm area. The gross loss may amount to 3.3bn pounds. Allianz is operating in 70 countries worldwide, including UK and Ireland. However, they account only for 4% of the company’s revenue. The losses may become even more severe in case the storm covers the mainland Europe. Another negative for the Germany’s insurers comes from the active inflow of European banks capital to the bonds market after the monetary stimulus program was implemented by ECB. The begin competing with the insurers for secure investment assets and projects which leads to lower returns. Allianz gets consistent operational and net profit. Its stocks are traded with Р/Е of 11 which is close to the average in insurance sector. This significantly limits the potential for stock prices fall. The company’s accounts for Q4 2015 will be released in mid-February 2016.
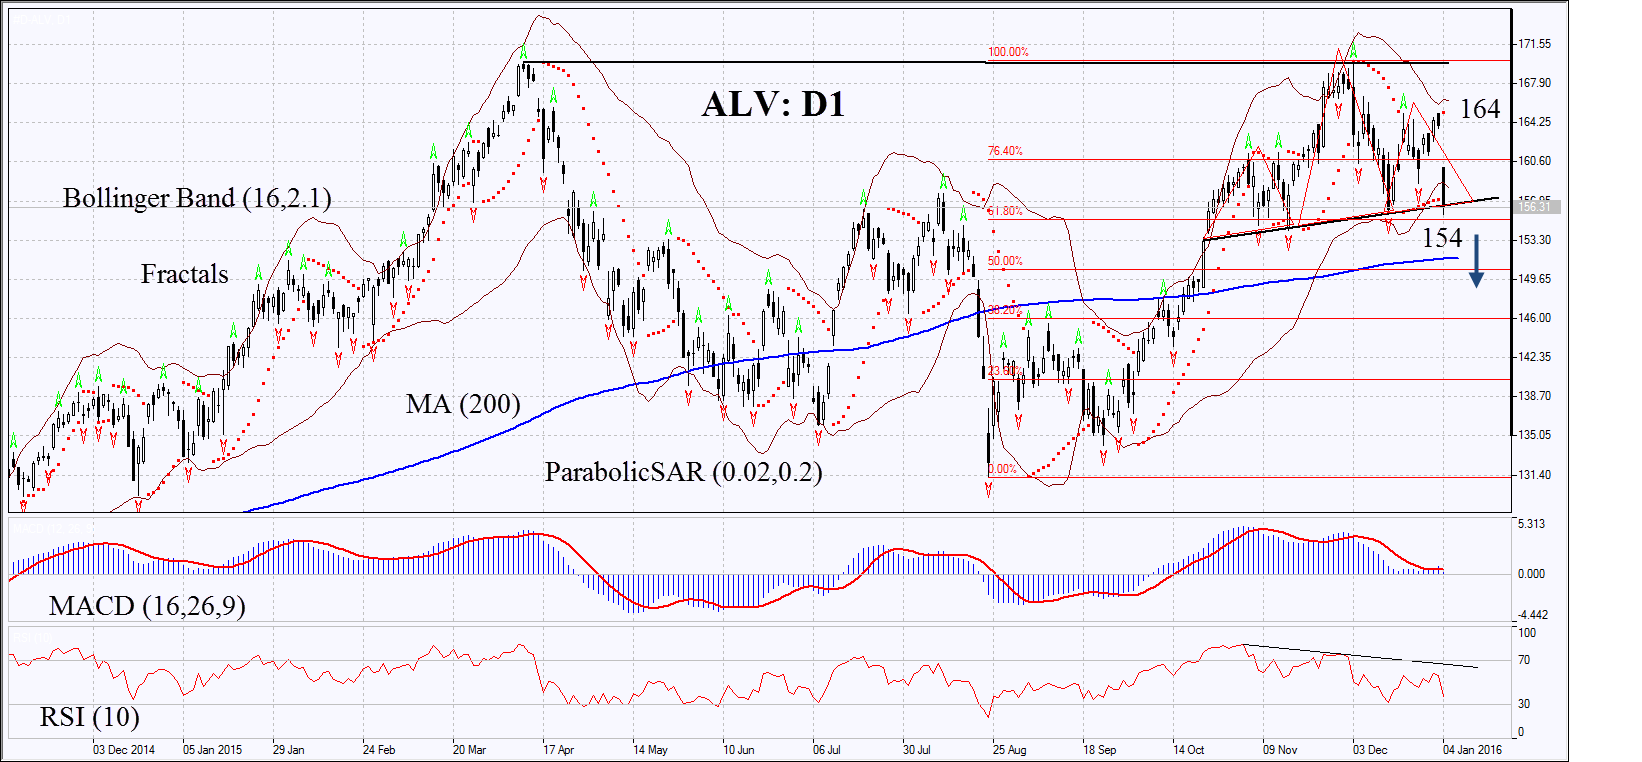
On the daily chart ALV: D1 has formed the “head and shoulders” chart pattern. On Monday it opened with a bid gap down and is struggling for breaking down the support or the neckline. The weekly chart illustrates the attempt to form the double top. Parabolic and MACD indicators give sell signals. The Bollinger bands have contracted which may mean lower volatility. RSI has partly played out the negative divergence seen while the “head” was forming. Now it is neutral and has not yet reached the oversold zone. The bearish momentum may develop in case the Allianz stocks break down the neckline and the Fibonacci level at 154. This level may serve the point of entry. The initial risk-limit may be placed in case of the gap closure at 164. Having opened the pending order we shall move the stop to the next fractal high following the Parabolic and Bollinger signals. Thus, we are changing the probable profit/loss ratio to the breakeven point. The most risk-averse traders may switch to the 4-hour chart after the trade and place there a stop-loss moving it in the direction of the trade. If the price meets the stop-loss level at 164 without reaching the order at 154, we recommend cancelling the position: the market sustains internal changes which were not taken into account.
| Position | Sell |
| Sell stop | below 154 |
| Stop loss | above 164 |
Explore our
Trading Conditions
- Spreads from 0.0 pip
- 30,000+ Trading Instruments
- Stop Out Level - Only 10%
Ready to Trade?
Open Account Note:
This overview has an informative and tutorial character and is published for free. All the data, included in the overview, are received from public sources, recognized as more or less reliable. Moreover, there is no guarantee that the indicated information is full and precise. Overviews are not updated. The whole information in each overview, including opinion, indicators, charts and anything else, is provided only for familiarization purposes and is not financial advice or а recommendation. The whole text and its any part, as well as the charts cannot be considered as an offer to make a deal with any asset. IFC Markets and its employees under any circumstances are not liable for any action taken by someone else during or after reading the overview.
