- Analytics
- Technical Analysis
AUD/USD Technical Analysis - AUD/USD Trading: 2017-01-05
The Australian dollar strengthened with the yuan
From January 1, 2017 China tightened the control over the outflow of the capital and the acquisition of the foreign currency by private buyers. This contributed to the strengthening of yuan and the Australian dollar. The dynamics of their exchange rate is often the same, since because of the peculiarities of the Chinese currency legislation, the part of settlements between local companies takes place not in yuan but in Australian dollars. Will AUDUSD continue rising?
China accounts for about one third of Australia’s exports. In 2016, yuan weakened against the US dollar by 7%, the biggest annual decline since 1994. At the end of the last week, the Chinese State Administration of Foreign Exchange introduced new, stricter rules for individual buyers of foreign currency in the country. Important factors which can strengthen the Australian dollar are good economic data. Moreover, this applies not only to Australia, but also to China. Positive industrial PMIs for December came out on Tuesday: Australian AiG Performance of Manufacturing and Chinese Caixin PMI. They both exceeded the preliminary forecasts. Due to this, the Australian stock index S&P/ASX 200 increased and reached the 19-month high. The exchange rate of the Australian dollar strengthened as well. On Tuesday early in the morning, January 5, 2017, the Services and Composite PMIs will be released in China and Australia. There are no accurate forecasts on them, but they may increase as well. The Australian trade balance for November will come out on Friday. In our opinion, its forecast is positive for the Australian dollar. However, the main factors determining the dynamics of AUDUSD are likely to be the data on the US labor market which will also be released on Friday.
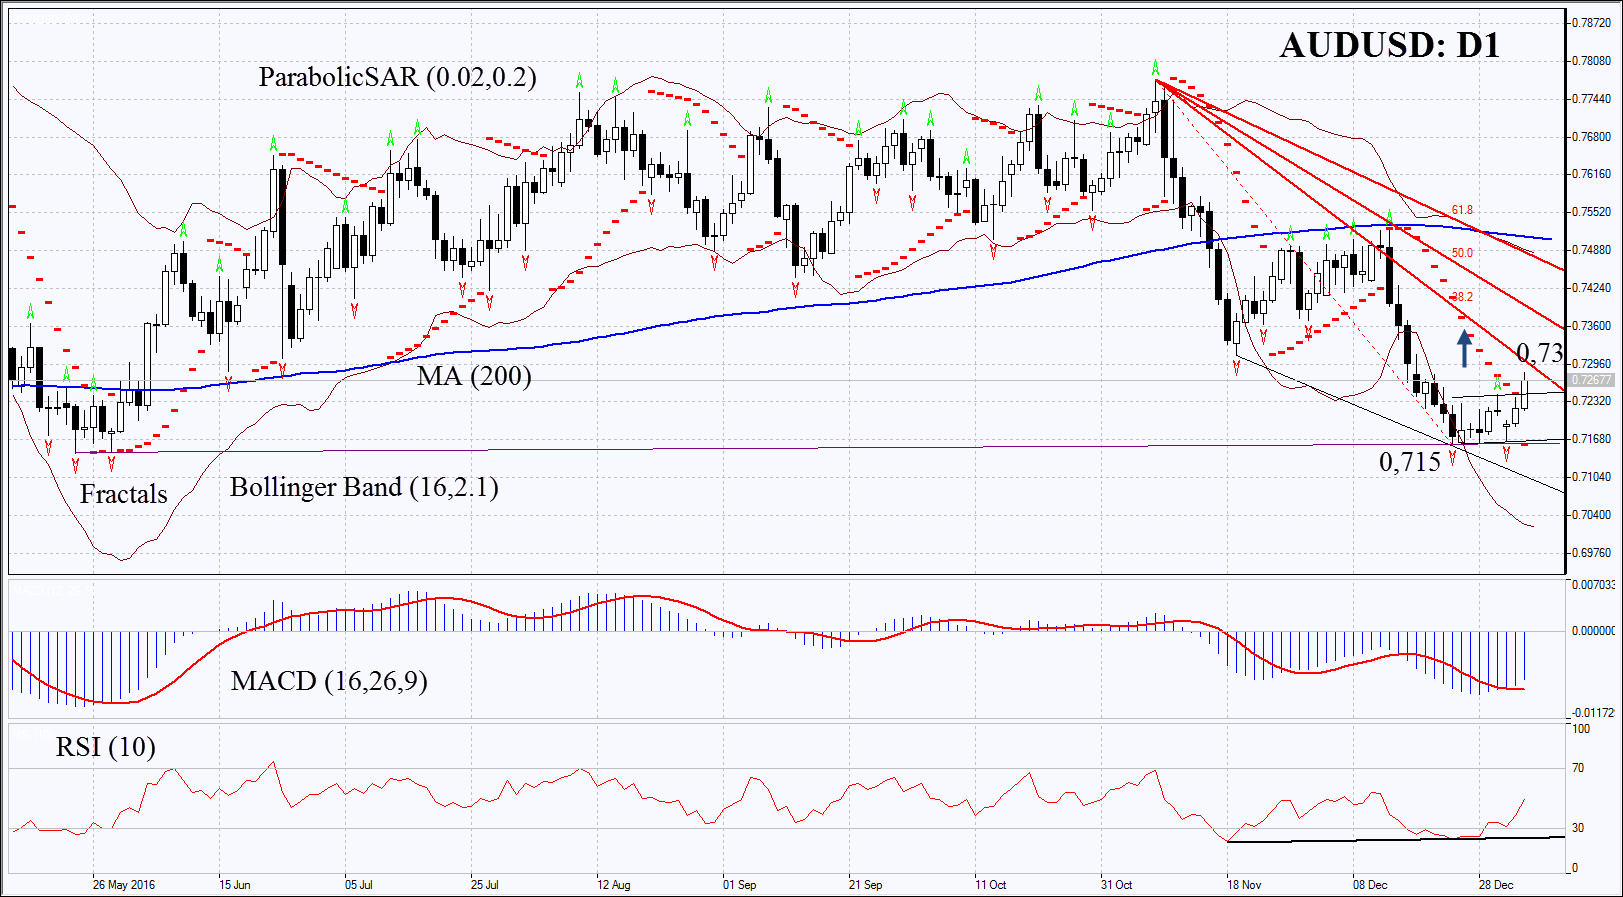
On the daily chart AUDUSD: D1 could not overcome the 7-month low and slightly corrected up. It still remains in the medium-term downtrend. Accordingly, in order to open a buy position, the exchange rate should exceed its resistance level coinciding with the 1st line of Fibonacci Fan. Further price increase is possible in case of positive economic data in Australia and China and negative in the US.
- Parabolic indicator gives a bullish signal.
- Bollinger bands have widened which indicates high volatility.
- RSI indicator is below 50. It has formed slight positive divergence
- MACD indicator gives a bullish signal.
The bullish momentum may develop in case AUDUSD overcomes the 1st line of Fibonacci Fan at 0, 73. The initial stop-loss may be placed below the last two fractal lows, the Parabolic signal and the 7-month low at 0,715. After opening the pending order we shall move the stop to the next fractal low following the Parabolic and Bollinger signals. Thus, we are changing the probable profit/loss ratio to the breakeven point. The most risk-averse traders may switch to the 4-hour chart after the trade and place there a stop-loss moving it in the direction of the trade. If the price meets the stop-loss level at 0,715 without reaching the order at 0, 73, we recommend cancelling the position: the market sustains internal changes which were not taken into account.
Technical Analysis Summary
| Position | Buy |
| Buy stop | above 0,73 |
| Stop loss | below 0,715 |
Explore our
Trading Conditions
- Spreads from 0.0 pip
- 30,000+ Trading Instruments
- Stop Out Level - Only 10%
Ready to Trade?
Open Account Note:
This overview has an informative and tutorial character and is published for free. All the data, included in the overview, are received from public sources, recognized as more or less reliable. Moreover, there is no guarantee that the indicated information is full and precise. Overviews are not updated. The whole information in each overview, including opinion, indicators, charts and anything else, is provided only for familiarization purposes and is not financial advice or а recommendation. The whole text and its any part, as well as the charts cannot be considered as an offer to make a deal with any asset. IFC Markets and its employees under any circumstances are not liable for any action taken by someone else during or after reading the overview.
