- Analytics
- Technical Analysis
NZD/CAD Technical Analysis - NZD/CAD Trading: 2019-11-20
In New Zealand the economic data was positive
The second milk auction in November was successfully held in New Zealand (Global Dairy Trade). Will the NZDCAD quotations grow?
Their increase indicates the strengthening of the New Zealand dollar against the Canadian dollar. Global Dairy Trade Price Index rose on 1,7%, after rising on 3.7% at the previous auction. Trading volume fell slightly by 1.8%. The dairy industry generates more than 7% of New Zealand's GDP, therefore, its indicators affect the local currency rate. The Reserve Bank of New Zealand (RBNZ) decided to maintain the rate of 1% at its last meeting in 2019. Now the interest rate will stay unchanged until the next meeting on February 12, 2020. The negative factor for Canadian dollar is the decline in international oil prices due to production increase and a delay in US-Chinese trade talks. Carolyn Wilkins, Deputy Governor of the Bank of Canada spoke about the risks to the global economy. Investors fear that this may be a hint of willingness to decrease the rate. The inflation in Canada for October will come out in November 20, which may affect the dynamics of the Canadian dollar.
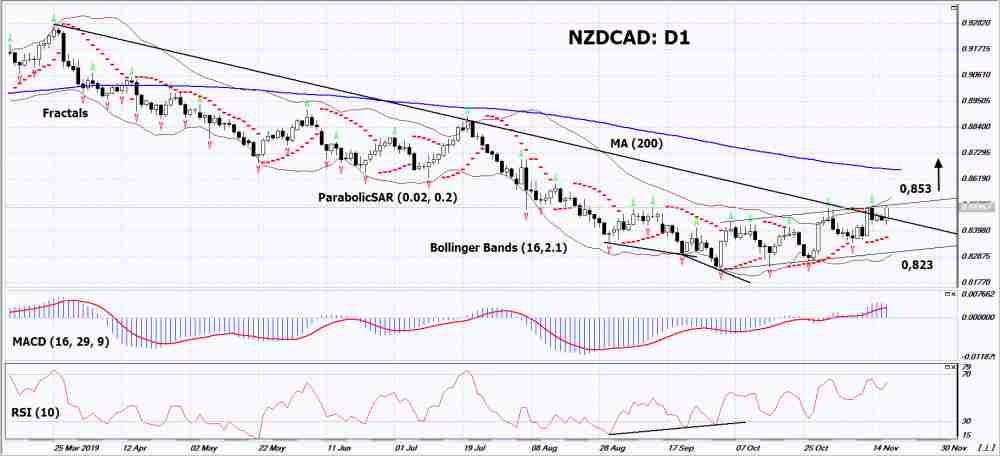
On the daily timeframe, NZDCAD: D1 is correcting upwards from the lowest since August 2015. It has breached up the resistance line of the downtrend. Various technical analysis indicators have generated signals to increase. The further growth is possible in the case of positive data in New Zealand and negative data in Canada.
- The Parabolic Indicator gives a bullish signal.
- The Bollinger bands have narrowed, which indicate low volatility. Both Bollinger Lines Slope Up.
- The RSI indicator is above the mark of 50. It has formed a divergence to increase.
- The MACD indicator gives a bullish signal.
We expect that the bullish movements may develop if NZDCAD exceeds the upper Bollinger line and its last upper fractal and the upper Bollinger line: 0,853. This level can be used as an entry point. The initial stop loss may be placed below the Parabolic signal, the lower Bollinger line and the low since August 2015: 0,823. After opening the pending order, we shall move the stop to the next fractal low following the Bollinger and Parabolic signals. Thus, we are changing the potential profit/loss to the breakeven point. More risk-averse traders may switch to the 4-hour chart after the trade and place there a stop loss moving it in the direction of the trade. If the price meets the stop loss level (0,823) without reaching the order (0,853), we recommend canceling the order: the market sustains internal changes, which were not taken into account.
Technical Analysis Summary
| Position | Buy |
| Buy stop | Above 0,853 |
| Stop loss | Below 0,823 |
Explore our
Trading Conditions
- Spreads from 0.0 pip
- 30,000+ Trading Instruments
- Stop Out Level - Only 10%
Ready to Trade?
Open Account Note:
This overview has an informative and tutorial character and is published for free. All the data, included in the overview, are received from public sources, recognized as more or less reliable. Moreover, there is no guarantee that the indicated information is full and precise. Overviews are not updated. The whole information in each overview, including opinion, indicators, charts and anything else, is provided only for familiarization purposes and is not financial advice or а recommendation. The whole text and its any part, as well as the charts cannot be considered as an offer to make a deal with any asset. IFC Markets and its employees under any circumstances are not liable for any action taken by someone else during or after reading the overview.
