- Analytics
- Technical Analysis
TENCENT Technical Analysis - TENCENT Trading: 2019-05-24
Slowing sales forecast bearish for Tencent price
Tencent stock declined after the company forecast slowdown in sales in 2019. Will the Tencent price continue declining?
Hong Kong based media and entertainment group Tencent Holdings forecast sharp slowdown in video advertising sales in China in 2019. Its chief executive officer of video streaming business told Tuesday the growth rate of advertising sales on China's video platforms would decrease from 37% previously to 19%. Online advertising contributed 13.4 billion yuan ($1.94 billion), or nearly 16% of Tencent's total revenue in the first quarter of 2019. Gaming, news and video were the largest contributor to sales, accounting for 33% of revenue in the three months to March. Total revenue in the first quarter rose 16% - about a third of its pace in the same period a year earlier and the slowest revenue growth in the first quarter in 15 years. Lower revenue forecast is bearish for Tencent stock price.
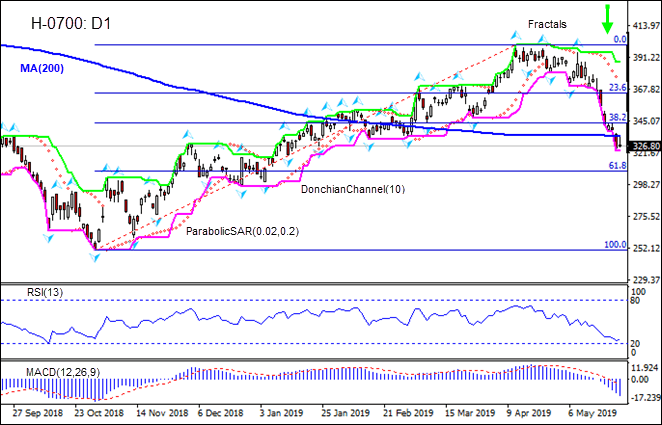
On the daily timeframe the H-0700: D1 has closed below the 200-day moving average MA(200) which is falling. This is bearish.
- The Parabolic indicator gives a sell signal.
- The Donchian channel indicates downtrend: it is tilted lower.
- The MACD indicator gives a bearish signal: it is below the signal line and the gap is widening.
- The RSI oscillator is rising after failing to breach into the oversold zone.
We believe the bearish momentum will continue after the price breaches below the lower boundary of Donchian channel at 323.15. This level can be used as an entry point for placing a pending order to sell. The stop loss can be placed above the Parabolic signal at 370.48. After placing the order, the stop loss is to be moved every day to the next fractal high, following Parabolic signals. Thus, we are changing the expected profit/loss ratio to the breakeven point. If the price meets the stop loss level (370.48) without reaching the order (323.15), we recommend cancelling the order: the market has undergone internal changes which were not taken into account.
Technical Analysis Summary
| Position | Sell |
| Sell stop | Below 323.15 |
| Stop loss | Above 370.48 |
Explore our
Trading Conditions
- Spreads from 0.0 pip
- 30,000+ Trading Instruments
- Stop Out Level - Only 10%
Ready to Trade?
Open Account Note:
This overview has an informative and tutorial character and is published for free. All the data, included in the overview, are received from public sources, recognized as more or less reliable. Moreover, there is no guarantee that the indicated information is full and precise. Overviews are not updated. The whole information in each overview, including opinion, indicators, charts and anything else, is provided only for familiarization purposes and is not financial advice or а recommendation. The whole text and its any part, as well as the charts cannot be considered as an offer to make a deal with any asset. IFC Markets and its employees under any circumstances are not liable for any action taken by someone else during or after reading the overview.
