- Analytics
- Technical Analysis
FR 40 Technical Analysis - FR 40 Trading: 2018-07-10
Preparing for the publication of economic data
The data on French industrial production for May will be published on Tuesday, July 10. Preliminary forecasts are positive. Will FR40 stock index prices increase?
Amid trade wars between the US and China, as well as disagreements over the terms of Brexit, stocks of French companies may be in demand by investors. Let us note that their semi-annual earnings reports will be published at the end of the next week. Currently, the CAC 40 index (FR40) is trading with the capitalization/earnings ratio (P/E) equal to 16.6. This is less than the US S&P 500 index equal to 22, but more than the German DAX and the British FTSE 100. Their P/E is now 13.
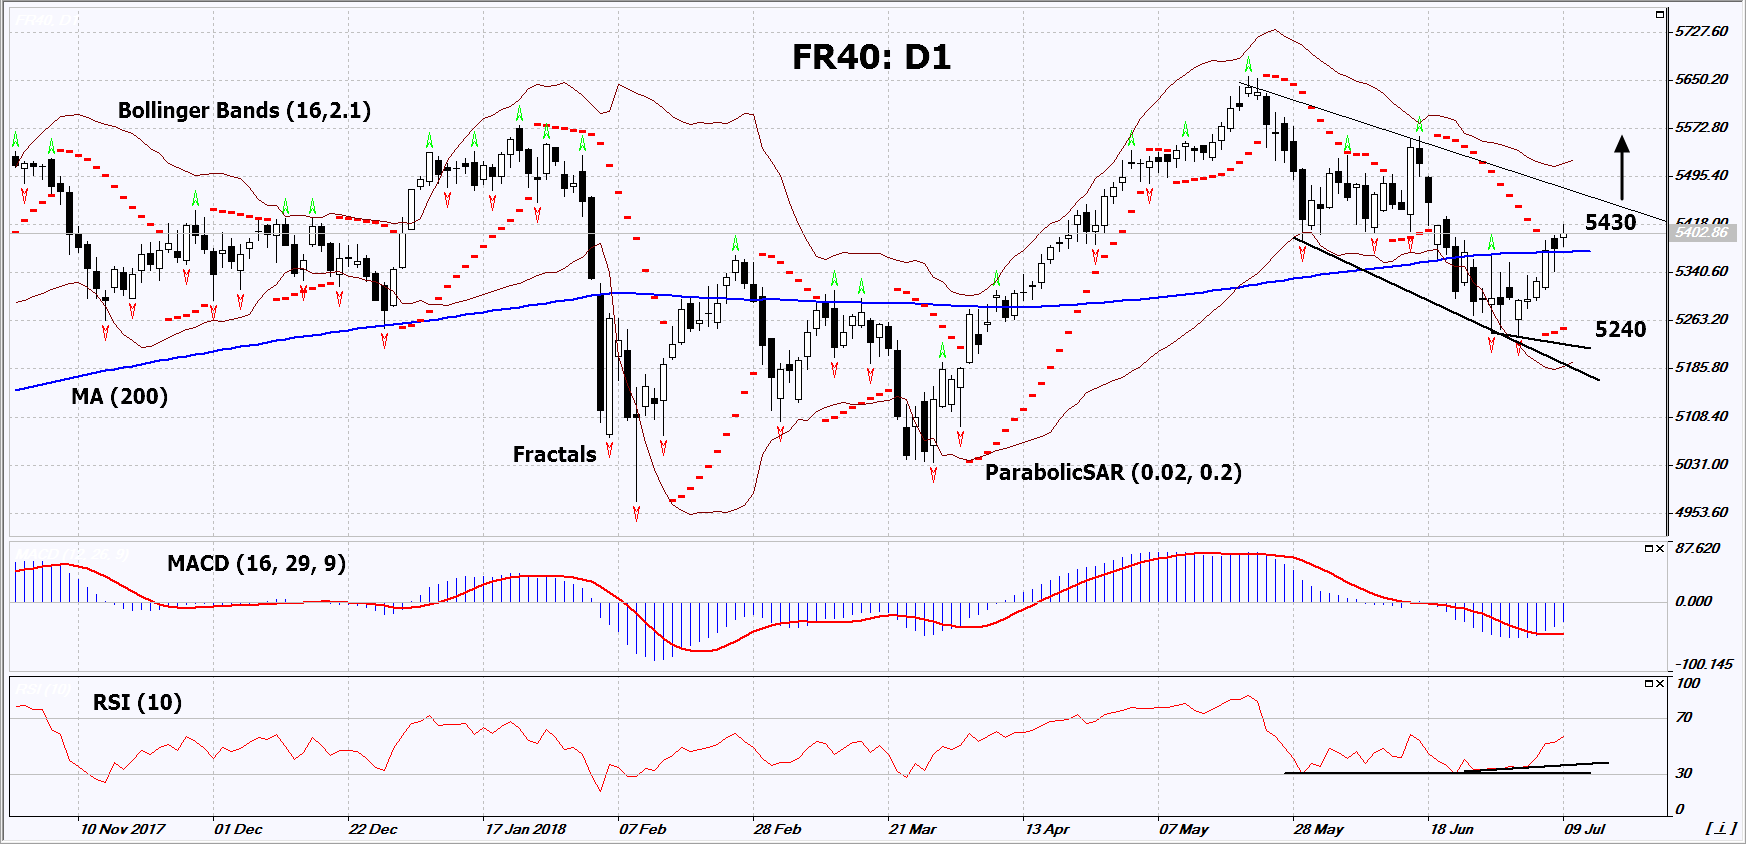
On the daily timeframe, FR40: D1 remains in the falling channel, but is correcting up. A number of technical analysis indicators formed buy signals. The index exceeded the 200-day moving average line. The further price increase is possible in case of the publication of good economic and corporate news in France.
- The Parabolic indicator gives a bullish signal.
- The Bollinger bands have widened, which indicates high volatility. They are titled upward.
- The RSI indicator is above 50. It has formed a positive divergence.
- The MACD indicator gives a bullish signal.
The bullish momentum may develop in case FR40 exceeds its last high at 5430. This level may serve as an entry point. The initial stop loss may be placed below the last fractal low, the 3-month low and the Parabolic signal at 5240. After opening the pending order, we shall move the stop to the next fractal low following the Bollinger and Parabolic signals. Thus, we are changing the potential profit/loss to the breakeven point. More risk-averse traders may switch to the 4-hour chart after the trade and place there a stop loss moving it in the direction of the trade. If the price meets the stop level (5240) without reaching the order (5430), we recommend to close the position: the market sustains internal changes that were not taken into account.
Summary of technical analysis
| Position | Buy |
| Buy stop | Above 5430 |
| Stop loss | Below 5240 |
Explore our
Trading Conditions
- Spreads from 0.0 pip
- 30,000+ Trading Instruments
- Stop Out Level - Only 10%
Ready to Trade?
Open Account Note:
This overview has an informative and tutorial character and is published for free. All the data, included in the overview, are received from public sources, recognized as more or less reliable. Moreover, there is no guarantee that the indicated information is full and precise. Overviews are not updated. The whole information in each overview, including opinion, indicators, charts and anything else, is provided only for familiarization purposes and is not financial advice or а recommendation. The whole text and its any part, as well as the charts cannot be considered as an offer to make a deal with any asset. IFC Markets and its employees under any circumstances are not liable for any action taken by someone else during or after reading the overview.
