- Analytics
- Technical Analysis
Infineon Technologies AG Technical Analysis - Infineon Technologies AG Trading: 2019-05-23
Lower sales forecast bearish for Infineon price
Infineon stock led technology sector rout after news the company had stopped shipments to Huawei. Will the Infineon price continue declining?
infineon Technologies AG stock slump led euro-zone technology retreat on Monday after news infineon had suspended shipments to Huawei following US ban on exports to China’s telecom giant. Couple of weeks before that company’s stock fell after Infineon reported no growth in revenue in the second quarter, though forecast a 5% rise in revenue to 8 billion euros ($8.96 billion) in the year to September 30. Chips used in cars account for more than two-fifths of Infineon's top selling output, and the company cited weaker Chinese demand for stagnant sales. It forecast “lower than normal seasonal revenue increase int the second half of the 2019 fiscal year”. Lower revenue forecast is bearish for Infineon stock price.
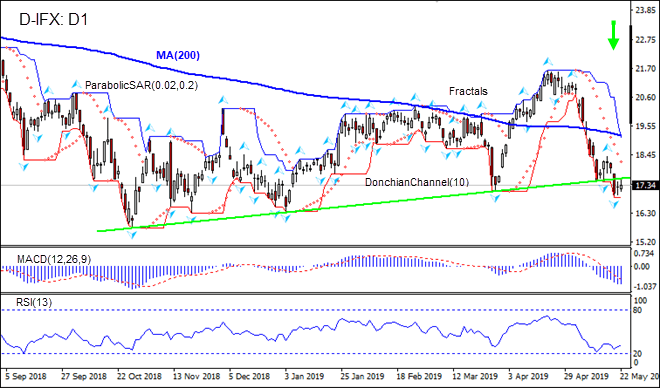
On the daily timeframe the D-IFX: D1 is below the 200-day moving average MA(200) which is falling. The price has breached below the support line. These are bearish.
- The Parabolic indicator gives a sell signal.
- The Donchian channel indicates downtrend: it is tilted lower.
- The MACD indicator gives a bearish signal: it is below the signal line and the gap is widening.
- The RSI oscillator is rising after failing to breach into the oversold zone.
We believe the bearish momentum will continue after the price breaches below the lower boundary of Donchian channel at 16.87. This level can be used as an entry point for placing a pending order to sell. The stop loss can be placed above the fractal high at 18.41. After placing the order, the stop loss is to be moved every day to the next fractal high, following Parabolic signals. Thus, we are changing the expected profit/loss ratio to the breakeven point. If the price meets the stop loss level (18.41) without reaching the order (16.87), we recommend cancelling the order: the market has undergone internal changes which were not taken into account.
Technical Analysis Summary
| Position | Sell |
| Sell stop | Below 16.87 |
| Stop loss | Above 18.41 |
Explore our
Trading Conditions
- Spreads from 0.0 pip
- 30,000+ Trading Instruments
- Stop Out Level - Only 10%
Ready to Trade?
Open Account Note:
This overview has an informative and tutorial character and is published for free. All the data, included in the overview, are received from public sources, recognized as more or less reliable. Moreover, there is no guarantee that the indicated information is full and precise. Overviews are not updated. The whole information in each overview, including opinion, indicators, charts and anything else, is provided only for familiarization purposes and is not financial advice or а recommendation. The whole text and its any part, as well as the charts cannot be considered as an offer to make a deal with any asset. IFC Markets and its employees under any circumstances are not liable for any action taken by someone else during or after reading the overview.
