- Analytics
- Technical Analysis
Hog Futures Technical Analysis - Hog Futures Trading: 2016-05-24
Strong price growth may weigh on pork demand
Pork prices edged lower on Friday for the 5th straight day. Market participants worry the US retailers purchased more meat than needed. USDA reported a slight fall in slaughtered pork last week. Next week, on May 30, the Day of the Dead is celebrated in the US which opens the so-called summer BBQ season when the demand for meat picks up. Tough to tell whether this year is to be the same. Since last November the pork has risen in price by half in US.
In China, that is the world major pork importer, the pork prices have added one third since the start of 2016 mainly on tougher ecological legislation and resulting exit from the market of small-scale producers. The share of big firms with more than 500 swine rose to 45% last year up from 20% in 2007. According to US Meat Export Federation, the US pork supplies to China rose in Q1 2016 by 283%. China consumes about 60mln tonnes of pork a year while the volume of world trade in pork is 7mln tonnes. So even a slight imbalance of supply and demand of pork in China may have a huge influence on global prices. Last year imported 780 thousand tonnes which accounted for about 1.5% of national consumption. In theory, such a strong pork prices increase this year may weigh on demand.
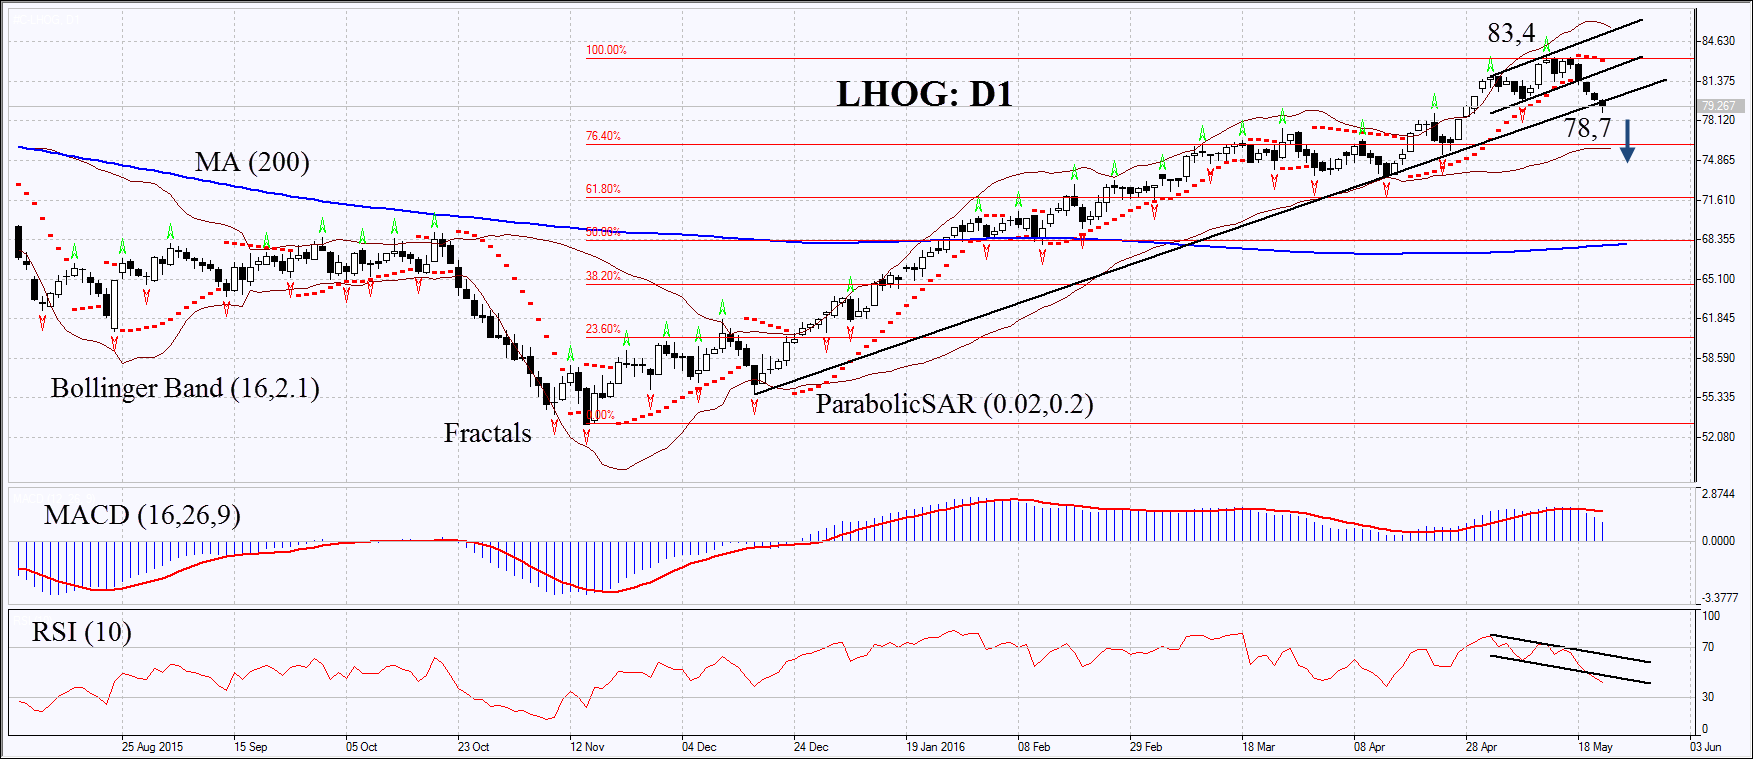
On the daily chart LHOG: D1 has hit a fresh 11-month high in mid-May. After that it began correcting down and broke through the support of the uptrend. The MACD and Parabolic indicators give signals to sell. The RSI has formed negative divergence. It fell below 50 but has not yet reached the oversold zone. The Bollinger bands have widened a lot which means higher volatility. The bearish momentum may develop in case the pork prices fall below the Monday low of 78.7. This level may serve the point of entry. The initial stop-loss may be placed above the high since 2015 and two fractal highs at 83.5. Having opened the pending order we shall move the stop to the next fractal high following the Parabolic and Bollinger signals. Thus, we are changing the probable profit/loss ratio to the breakeven point. The most risk-averse traders may switch to the 4-hour chart after the trade and place there a stop-loss moving it in the direction of the trade. If the price meets the stop-loss level at 83.5 without reaching the order at 78.7, we recommend cancelling the position: the market sustains internal changes which were not taken into account.
| Position | Sell |
| Sell stop | below 78.7 |
| Stop loss | above 83.4 |
Explore our
Trading Conditions
- Spreads from 0.0 pip
- 30,000+ Trading Instruments
- Stop Out Level - Only 10%
Ready to Trade?
Open Account Note:
This overview has an informative and tutorial character and is published for free. All the data, included in the overview, are received from public sources, recognized as more or less reliable. Moreover, there is no guarantee that the indicated information is full and precise. Overviews are not updated. The whole information in each overview, including opinion, indicators, charts and anything else, is provided only for familiarization purposes and is not financial advice or а recommendation. The whole text and its any part, as well as the charts cannot be considered as an offer to make a deal with any asset. IFC Markets and its employees under any circumstances are not liable for any action taken by someone else during or after reading the overview.
