- Analytics
- Technical Analysis
Nikkei 225 Technical Analysis - Nikkei 225 Trading: 2018-07-06
Weaker Japanese data bearish for NIKKEI
Japanese big manufacturers’ business confidence and consumers’ confidence declined in June. Will the NIKKEI continue declining?
Recent Japanese economic data were negative on balance after the Bank of Japan June meeting. While Nikkei manufacturing PMI rose in June and unemployment fell in May, retail sales growth slowed to 0.6% over year in May from 1.5% in April and construction orders fell 18.7% over year in May after 4% growth in previous month. And while housing starts rose in May, both the consumer confidence and Japanese big manufacturers’ business confidence reflected in quarterly “tankan” survey worsened in June from three months ago. Weaker economic data are bearish for NIKKEI.
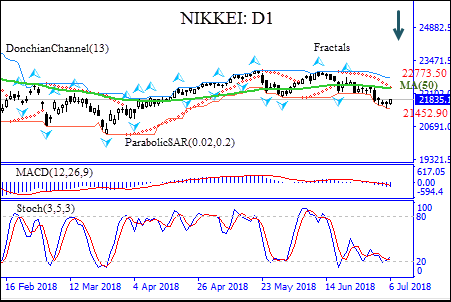
On the daily timeframe the NIKKEI: D1 is below the 50-day moving average MA(50) which has leveled off.
- The Parabolic indicator gives a sell signal.
- The Donchian channel indicates downtrend: it is tilted lower.
- The MACD indicator gives a bearish signal: it is below the signal line and the gap is widening.
- The Stochastic oscillator is rising but has not reached the overbought zone.
We believe the bearish momentum will continue after the price breaches below the lower boundary of Donchian channel at 21452.90. This level can be used as an entry point for placing a pending order to sell. The stop loss can be placed above the upper Donchian channel at 22773.50. After placing the order, the stop loss is to be moved every day to the next fractal high, following Parabolic signals. Thus, we are changing the probable profit/loss ratio to the breakeven point. If the price meets the stop loss level (21452.90) without reaching the order (22773.50), we recommend cancelling the order: the market has undergone internal changes which were not taken into account.
Technical Analysis Summary
| Position | Sell |
| Sell stop | Below 21452.90 |
| Stop loss | Above 22773.50 |
Explore our
Trading Conditions
- Spreads from 0.0 pip
- 30,000+ Trading Instruments
- Stop Out Level - Only 10%
Ready to Trade?
Open Account Note:
This overview has an informative and tutorial character and is published for free. All the data, included in the overview, are received from public sources, recognized as more or less reliable. Moreover, there is no guarantee that the indicated information is full and precise. Overviews are not updated. The whole information in each overview, including opinion, indicators, charts and anything else, is provided only for familiarization purposes and is not financial advice or а recommendation. The whole text and its any part, as well as the charts cannot be considered as an offer to make a deal with any asset. IFC Markets and its employees under any circumstances are not liable for any action taken by someone else during or after reading the overview.
